
https://www.parl.ca/diplomacy/en
Canada’s parliamentary diplomacy is led by two Speakers.
The Honourable Anthony Rota, Speaker of the House of Commons
https://www.ourcommons.ca/boie/en/membership
Membership of the Board
Current Membership


Board Composition
The Board consists of:
- The Speaker, who acts as Chair,
-
two members of the Privy Council
(appointed to the board by the Government) - The Leader of the Opposition or his or her representative, and
- additional Members appointed in numbers so that there are an equal number of Government and opposition representatives (apart from the Speaker).
The Clerk of the House of Commons, who reports to the Speaker, serves as Secretary to the Board.
Changes to Membership
For changes to BOIE membership, including previous parliaments, please consult the Roles and Membership page where information can be found for a given date.
Appointment of the Clerk of the House of Commons
The Clerk of the House of Commons is appointed by the Governor-in-Council under the provisions of the Public Service Employment Act , though neither the Clerk nor any staff of the House of Commons are technically part of the federal public service. The Clerk is required under the Parliament of Canada Act to swear an oath of allegiance administered by the Speaker of the House.
In 2001, the House agreed to a recommendation contained in the First Report of the Special Committee on the Modernization and Improvement of the Procedures of the House of Commons that provided for a committee review of any proposed appointment of a Clerk of the House of Commons and a subsequent ratification vote by the House.
As a result of this recommendation, the Standing Orders were amended to provide that when the Government intends to appoint a person to the position of Clerk of the House of Commons, the name of the proposed appointee is referred to the Standing Committee on Procedure and House Affairs. The Committee may consider the appointment during a period of not more than thirty days and may report its views to the House.
Following this, a motion to ratify the appointment is put to the House during Routine Proceedings, and is decided without debate or amendment.
This procedure was used for the first time in 2005 when the proposed appointment of Audrey O'Brien was reviewed and recommended by the Standing Committee on Procedure and House Affairs , and was subsequently ratified by the House.
Related Links
Office of the Clerk
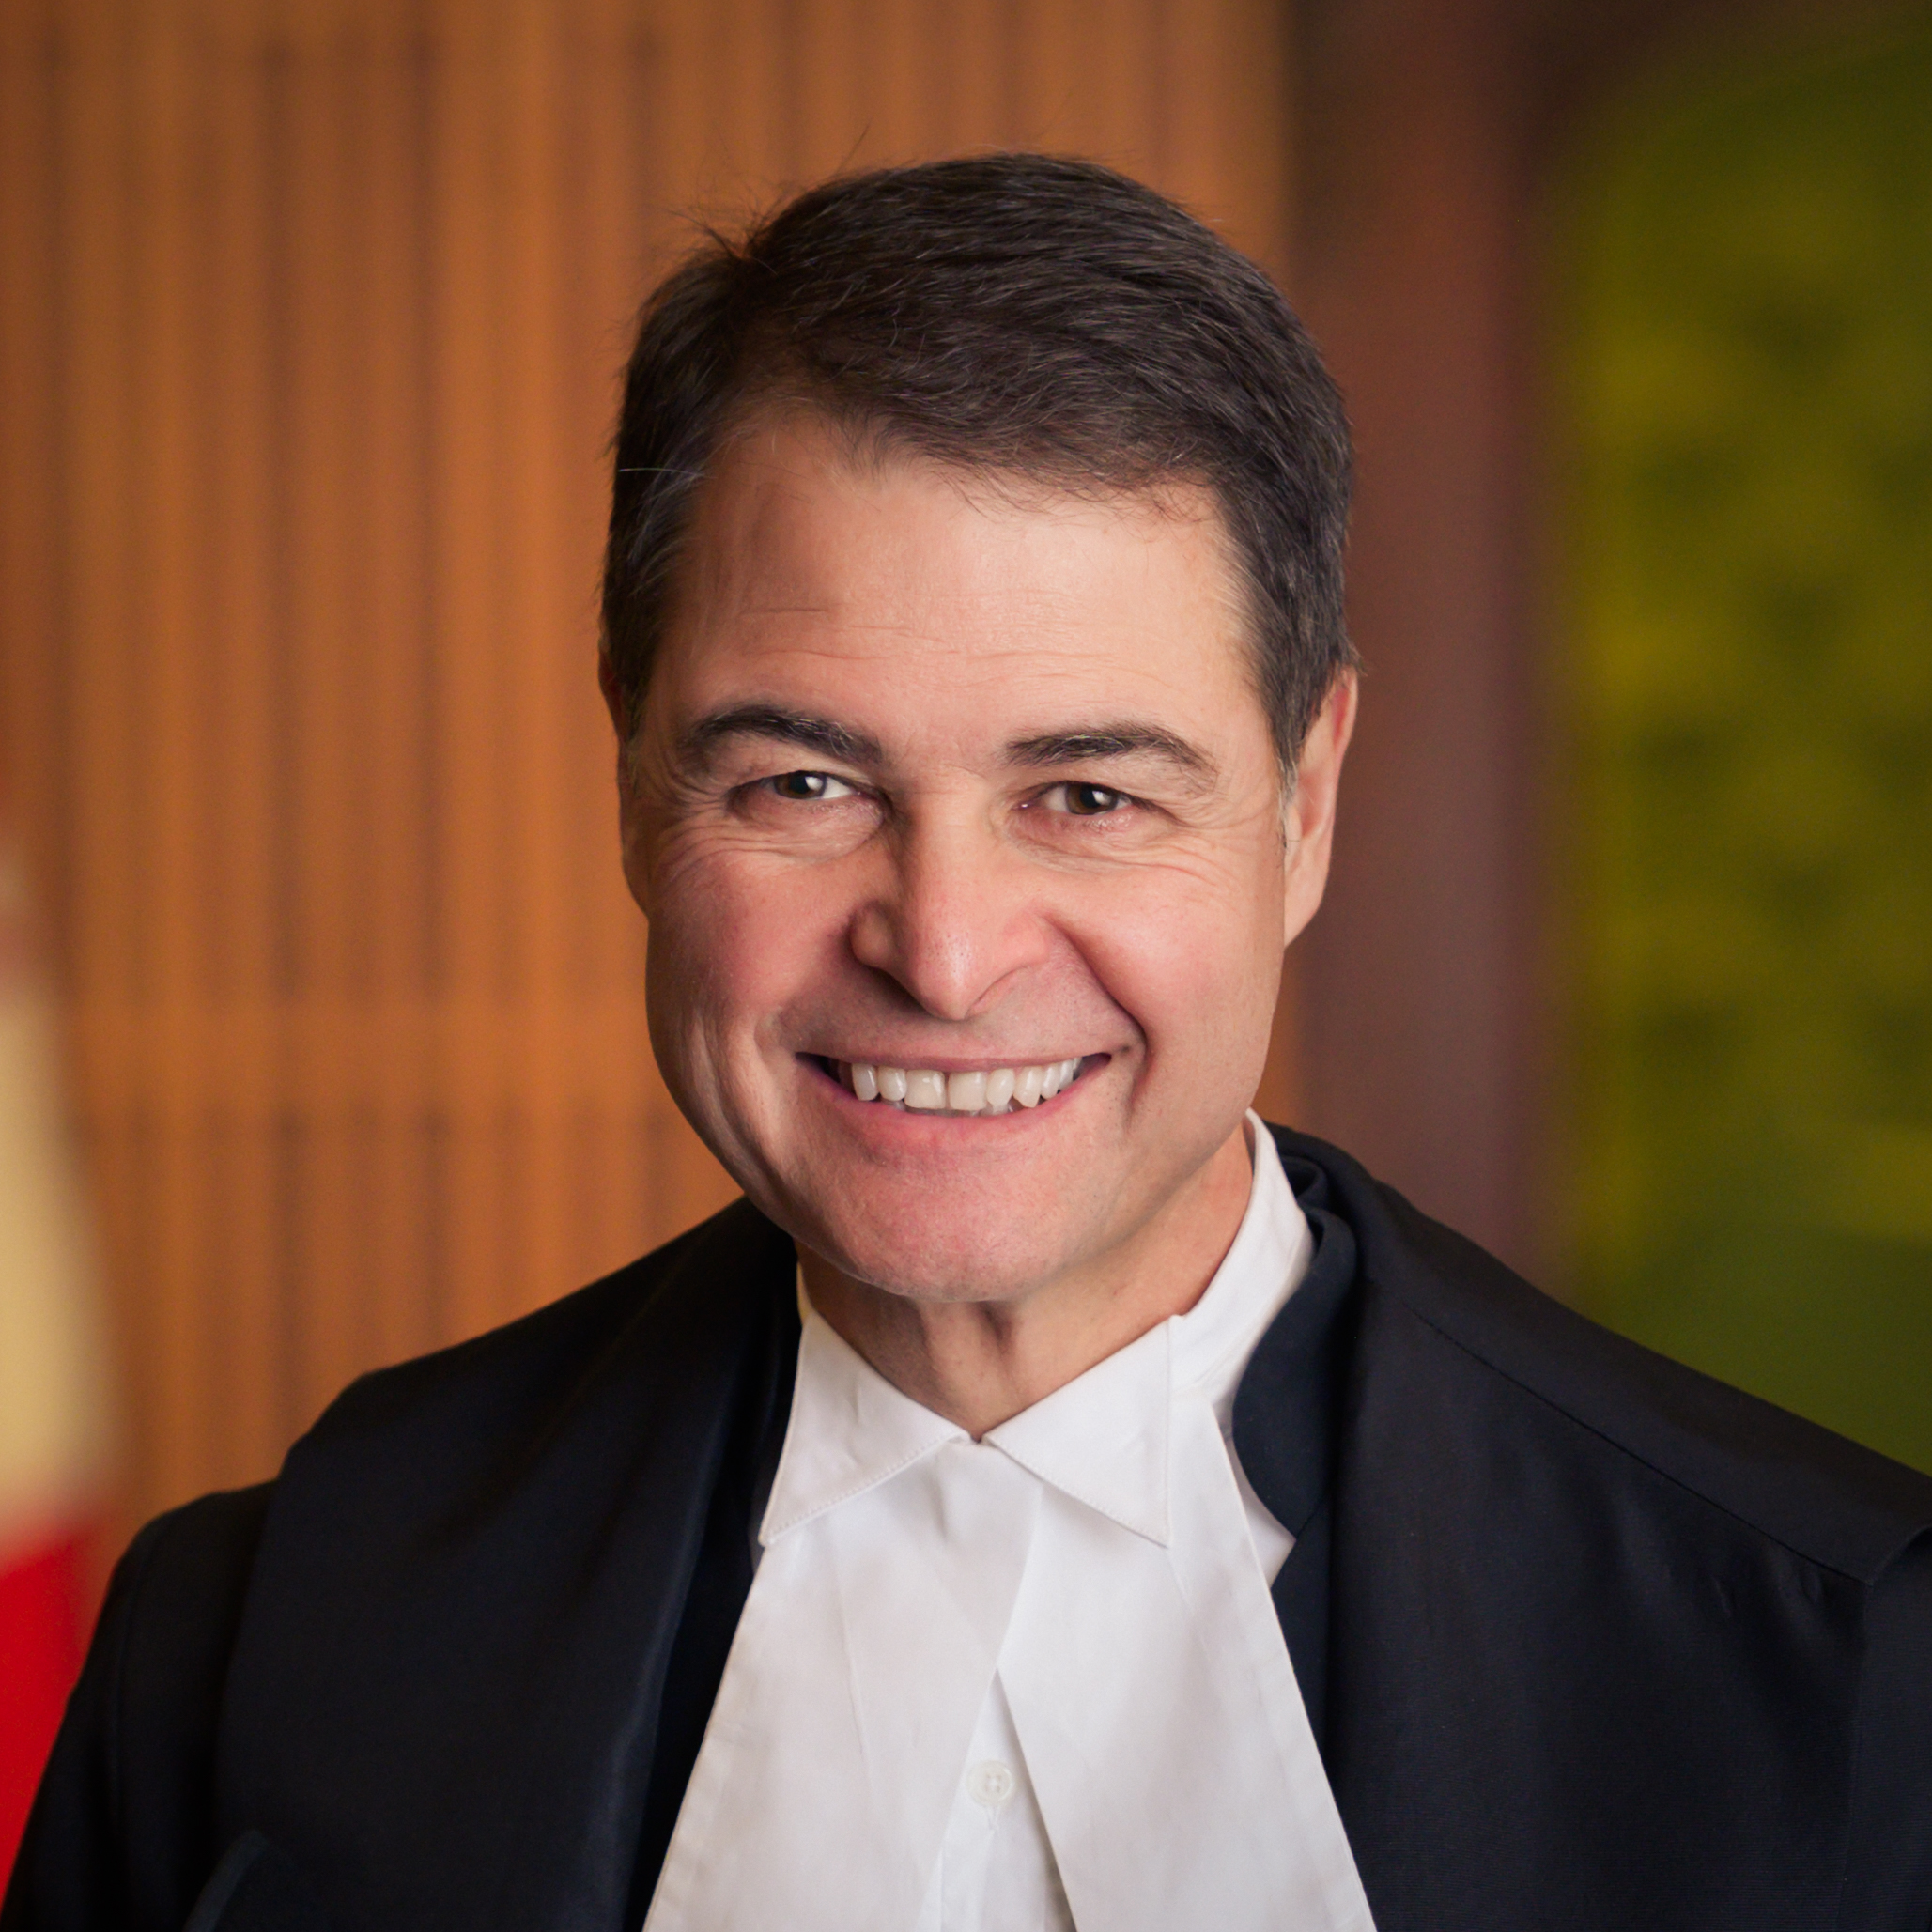
Visitors to the House of Commons and those watching its proceedings on television have surely noticed the officials in black robes sitting at the Table in front of the Speaker’s Chair. These are the Clerks-at-the-Table, non-partisan officials who provide advice to the Speaker and to Members and who record the decisions of the House. At the head of the Table sits the Clerk of the House, the senior permanent official of the House of Commons.
This Web site will provide insight into the role of the Clerk, the manner in which the Clerk is appointed, the long history of the office, as well the administrative structure of the House of Commons. Charles Robert was appointed Clerk of the House of Commons on July 10, 2017.
Roles and Responsibilities
Members are supported in their parliamentary functions by services administered by the Clerk of the House who, as the chief executive of the House administration, reports to the Speaker . The Clerk advises the Speaker and all Members on the interpretation of parliamentary rules, precedents and practices. The Clerk is at the service of all Members, regardless of party affiliation, and must act with impartiality and discretion.
The Clerk is responsible for maintaining records of the proceedings of the House and for keeping custody of these records and other documents in the possession of the House. All decisions of the House are authenticated by signature of the Clerk.
At the beginning of a Parliament, the Clerk administers the oath of allegiance to all duly elected Members as required by the Constitution Act, 1867.
The Clerk acts as Secretary to the Board of Internal Economy, the governing body that has responsibility over all financial and administrative matters respecting the House of Commons. The Clerk also administers an oath to Members joining the Board of Internal Economy.
In addition, the Clerk frequently receives delegations of parliamentary officials from other legislatures and participates in interparliamentary activities.
Clerk's Management Group
The Clerk's Management Group (CMG) is an executive governing body representing all services across the House of Commons. It makes recommendations to the Speaker and the Board of Internal Economy regarding the administration of the House of Commons.
The Clerk's Management Group is chaired by the Clerk and is comprised of the heads of the seven service areas:
- The Deputy Clerk (Procedural Services)
- The Law Clerk and Parliamentary Counsel (Office of the Law Clerk and Parliamentary Counsel)
- The Chief Financial Officer (Finance Services)
- The Chief Human Resources Officer (Human Resources Services)
- The Chief Information Officer (Digital Services and Real Property)
- Sergeant-at-Arms
- The Chief Operations Officer, Parliamentary Precinct Operations
The CMG is responsible for:
- Setting strategic directions, priorities and expected results for the House of Commons Administration;
- Ensuring that the House of Commons Administration has the financial and human resources necessary to carry out its mandate;
- Reviewing and/or approving all policies pertaining to the House of Commons Administration before they are submitted to the Board of Internal Economy for approval or for information; and
- Ensuring that the House of Commons Administration complies with approved policies and directives.
https://www.ourcommons.ca/members/en/anthony-rota(25452)#contact
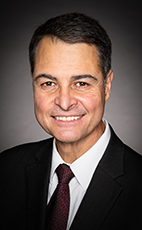
The Honourable Anthony Rota
Overview
- Political Affiliation:
- Liberal
- Constituency:
- Nipissing—Timiskaming
- Province / Territory:
- Ontario
- Preferred Language:
- English / French
Hill Office
House of Commons *
Ottawa, Ontario,
Canada
K1A 0A6
Telephone: 613-995-6255
Fax: 613-996-7993
https://pps.parl.ca/the-service/
2015
The Parliament of Canada Act is amended to create the Parliamentary Protective Service. This new parliamentary entity becomes the single security force protecting the Parliament of Canada. On June 23, 2015, the Senate Protective Service and the House of Commons Security Services were amalgamated into one unified security service under the operational command of the Royal Canadian Mounted Police.
Creation of the Service A new unified beginning.
On June 23, 2015, the Parliamentary Protective Service was created by law under the Parliament of Canada Act. The newly created parliamentary entity amalgamated the former Senate Protective Service and House of Commons Security Services into a single unified security service to serve the Parliament of Canada. The Director of the Service must be a member of the Royal Canadian Mounted Police (RCMP) by law, and he or she has control and management of the daily operations of the organization.
The Director executes his or her mandate under the joint general policy direction of the Speaker of the Senate and the Speaker of the House of Commons. The Speakers of both Houses, being responsible for the Service, and the Minister of Public Safety and Emergency Preparedness have entered into an arrangement to have the RCMP lead the physical security operations of the Service.
The Parliamentary Protective Service is a separate and distinct organization from the RCMP and the Government of Canada.
see legislative summaryCe lien s'ouvrira dans une nouvelle fenêtre"
Director of the Service Chief Superintendent Kevin Leahy
Chief Superintendent Leahy joined the RCMP in 1992 and did general duty policing in both Prince Edward Island as well as Newfoundland and Labrador. In 2001, he was posted in New Brunswick where he was later made in charge of Operations for the Southern portion of the Acadian Peninsula, in Tracadie.
In 2005, Chief Superintendent Leahy was transferred to RCMP New Brunswick headquarters in Fredericton where he served as a Career Development and Resourcing Advisor. Shortly after, he was promoted to the rank of Inspector where he became the Career Development and Resourcing Officer for the Division. After several years leading the human resources department of the RCMP in New Brunswick, he was named the Officer in Charge of Major Crime Support Services, where he oversaw all specialized policing services provided by the RCMP in New Brunswick.
In 2017, Chief Superintendent Leahy was transferred to the RCMP National Headquarters in Ottawa, and assumed the role of Employee Management Relations Officer, where he was responsible for the oversight of Occupational Health and Safety, Professional Responsibility and the Respectful Workplace Program.
In 2019, he was named as the third Director of the Parliamentary Protective Service and promoted to the rank of Chief Superintendent.
Chief Superintendent Leahy holds a Bachelor of Business Administration degree from Memorial University and a Certificate in Human Resource Management from the University of New Brunswick. He has also completed the Direction Program at the Canada School of Public Service.
Chief Superintendent Leahy, and his partner Yvonne, have four adult children and four grandchildren.
Organizational structure
Under the Parliament of Canada Act, the Speaker of the Senate and the Speaker of the House of Commons are responsible for the Service. The Director of the Service leads the integrated security operations throughout Parliament Hill and the Parliamentary Precinct under the joint general policy direction of the Speakers of both Houses.
Reporting structure
The Director of the Parliamentary Protective Service reports directly to the Speakers of the Senate and the House of Commons, who act as custodians of the powers, rights, privileges and immunities of their respective chambers and members.
The Director also reports to the Commissioner of the Royal Canadian Mounted Police on operational matters. The Royal Canadian Mounted Police leads security-related activities in accordance with the terms of an agreement between the Speakers of both Houses and the Minister of Public Safety and Emergency Preparedness.
Senior Executive Committee
The Senior Executive Committee meets weekly and is responsible for advising the Director on the administrative, policy and operational direction of the organization.
Membership
- Director of the Parliamentary Protective Service (chair)
- Senior Security Officer
- Special Advisor, Diversity, Inclusion and Belonging
- Chief of Staff
- General Counsel
- Chief Financial Officer
- Chief Human Resources Officer
- Chief Information Officer
- Chief Operations Officer
- Chief Planning Officer
General information
Parliamentary Protective Service
Headquarters
Ottawa, Ontario
K1A 0B8
Canada
Monday to Friday (except holidays)
8:30 a.m. – 4:30 p.m. (EST)
613-995-4300
communications@pps-spp.parl.gc.ca
I
doubt that Élisabeth Brière - Députée fédérale de Sherbrooke even knows
who I am, so I called her office and that of big bad Billy Boy Blair's
before sending them an email
https://www.facebook.com/ElisabethBrierePLC/
---------- Original message ----------
From: David Amos <david.raymond.amos333@gmail.
Date: Thu, 19 Dec 2019 08:53:14 -0400
Subject: YO Pat.Kelly Mikey Cohen the lawyer of your impeached Yankee
hero Mr Trump is in jail and your buddy Pierre-Luc Dusseault is gone
but you are the Shadow Cabinet Minister for Finance and my concerns
about FATCA, the CRA and the IRS still remain N'esy Pas?
To: "Pat.Kelly" <Pat.Kelly@parl.gc.ca>, joel@joelharden.ca
Cc: David Amos <motomaniac333@gmail.com>,
fin.minfinance-financemin.fin@
elizabeth.thompson@cbc.ca, "justin.ling@vice.com, elizabeththompson"
<elizabeththompson@ipolitics.
<president@whitehouse.gov>, mdcohen212@gmail.com, pm <pm@pm.gc.ca>,
Jean-Yves.Duclos@parl.gc.ca, washington field
<washington.field@ic.fbi.gov>, "Boston.Mail" <Boston.Mail@ic.fbi.gov>,
"Frank.McKenna" <Frank.McKenna@td.com>, "hon.ralph.goodale"
<hon.ralph.goodale@canada.ca>, "Diane.Lebouthillier"
<Diane.Lebouthillier@cra-arc.
<Brenda.Lucki@rcmp-grc.gc.ca>, ethics-ethique
<ethics-ethique@rcmp-grc.gc.ca>, "Bill.Morneau"
stephen.kimber@ukings.ca, "steve.murphy" <steve.murphy@ctv.ca>,
"Jacques.Poitras" <Jacques.Poitras@cbc.ca>, oldmaison
<oldmaison@yahoo.com>, andre <andre@jafaust.com>, Newsroom
<Newsroom@globeandmail.com>, "David.Akin" <David.Akin@globalnews.ca>,
"Robert. Jones" <Robert.Jones@cbc.ca>, David Amos
<david.raymond.amos@gmail.com>, lionel@lionelmedia.com,
press@bankofengland.co.uk, "jan.jensen" <jan.jensen@justice.gc.ca>,
"clare.barry" <clare.barry@justice.gc.ca>, mcu <mcu@justice.gc.ca>
Remember this old email? Scroll down there is more
https://davidraymondamos3.
>
>
> Wednesday, 23 January 2019
>
> 1.6 million Canadian banking records shared with IRS
> https://twitter.com/
>
> David Raymond Amos @DavidRayAmos
> Replying to @DavidRayAmos @Kathryn98967631 and 49 others
> Methinks if folks wish to know more about the Taxman, his pal Harper
> and his Yankee buddies they should Google the following N'esy Pas?
>
> David Amos IRS CRA KPMG FATCA Diane Lebouthillier
>
> https://davidraymondamos3.
>
> #nbpoli #cdnpoli #FATCA #IRS #CRA #Trump #Trudeau
>
>
>> ---------- Forwarded message ----------
>> From: "MinFinance / FinanceMin (FIN)"
>> <fin.minfinance-financemin.
>> Date: Tue, 14 Feb 2017 14:52:33 +0000
>> Subject: RE: RE FATCA, NAFTA & TPP etc ATTN President Donald J. Trump
>> I just got off the phone with your lawyer Mr Cohen (646-853-0114) Why
>> does he lie to me after all this time???
>> To: David Amos <motomaniac333@gmail.com>
>>
>> The Department of Finance acknowledges receipt of your electronic
>> correspondence. Please be assured that we appreciate receiving your
>> comments.
>>
>> Le ministère des Finances accuse réception de votre correspondance
>> électronique. Soyez assuré(e) que nous apprécions recevoir vos
>> commentaires.
>>
>>
>> ---------- Forwarded message ----------
>> From: David Amos <motomaniac333@gmail.com>
>> Date: Tue, 14 Feb 2017 10:51:14 -0400
>> Subject: RE FATCA, NAFTA & TPP etc ATTN President Donald J. Trump I
>> just got off the phone with your lawyer Mr Cohen (646-853-0114) Why
>> does he lie to me after all this time???
>> To: president <president@whitehouse.gov>, mdcohen212@gmail.com, pm
>> <pm@pm.gc.ca>, Pierre-Luc.Dusseault@parl.gc.
>> <MulcaT@parl.gc.ca>, Jean-Yves.Duclos@parl.gc.ca,
>> B.English@ministers.govt.nz, Malcolm.Turnbull.MP@aph.gov.au,
>> pminvites@pmc.gov.au, mayt@parliament.uk, press
>> <press@bankofengland.co.uk>, "Andrew.Bailey"
>> <Andrew.Bailey@fca.org.uk>,
>> fin.financepublic-
>> <newsroom@globeandmail.ca>, "CNN.Viewer.Communications.Management"
>> <CNN.Viewer.Communications.
>> <news-tips@nytimes.com>, lionel <lionel@lionelmedia.com>
>> Cc: David Amos <david.raymond.amos@gmail.com>,
>> elizabeth.thompson@cbc.ca, "justin.ling@vice.com, elizabeththompson"
>> <elizabeththompson@ipolitics.
>> "Bill.Morneau" <Bill.Morneau@canada.ca>, postur <postur@for.is>,
>> stephen.kimber@ukings.ca, "steve.murphy" <steve.murphy@ctv.ca>,
>> "Jacques.Poitras" <Jacques.Poitras@cbc.ca>, oldmaison
>> <oldmaison@yahoo.com>, andre <andre@jafaust.com>
>>
>> ---------- Original message ----------
>> From: Michael Cohen <mcohen@trumporg.com>
>> Date: Tue, 14 Feb 2017 14:15:14 +0000
>> Subject: Automatic reply: RE FATCA ATTN Pierre-Luc.Dusseault I just
>> called and left a message for you
>> To: David Amos <motomaniac333@gmail.com>
>>
>> Effective January 20, 2017, I have accepted the role as personal
>> counsel to President Donald J. Trump. All future emails should be
>> directed to mdcohen212@gmail.com and all future calls should be
>> directed to 646-853-0114.
>> ________________________________
>> This communication is from The Trump Organization or an affiliate
>> thereof and is not sent on behalf of any other individual or entity.
>> This email may contain information that is confidential and/or
>> proprietary. Such information may not be read, disclosed, used,
>> copied, distributed or disseminated except (1) for use by the intended
>> recipient or (2) as expressly authorized by the sender. If you have
>> received this communication in error, please immediately delete it and
>> promptly notify the sender. E-mail transmission cannot be guaranteed
>> to be received, secure or error-free as emails could be intercepted,
>> corrupted, lost, destroyed, arrive late, incomplete, contain viruses
>> or otherwise. The Trump Organization and its affiliates do not
>> guarantee that all emails will be read and do not accept liability for
>> any errors or omissions in emails. Any views or opinions presented in
>> any email are solely those of the author and do not necessarily
>> represent those of The Trump Organization or any of its
>> affiliates.Nothing in this communication is intended to operate as an
>> electronic signature under applicable law.
>>
>> ---------- Original message ----------
>> From: "Finance Public / Finance Publique (FIN)"
>> <fin.financepublic-
>> Date: Fri, 10 Feb 2017 22:05:00 +0000
>> Subject: RE: Yo President Trump RE the Federal Court of Canada File No
>> T-1557-15 lets see how the media people do with news that is NOT FAKE
>> To: David Amos <motomaniac333@gmail.com>
>>
>> The Department of Finance acknowledges receipt of your electronic
>> correspondence. Please be assured that we appreciate receiving your
>> comments.
>>
>> Le ministère des Finances accuse réception de votre correspondance
>> électronique. Soyez assuré(e) que nous apprécions recevoir vos
>> commentaires.
>>
>>
---------- Original message ----------
From: Bill.Blair.C1@parl.gc.ca
Date: Wed, 18 Dec 2019 16:26:28 +0000
Subject: Automatic reply: YO Jesús A. Hernández-García Does your
client Trevor Doyle and the Canadian Government know that you have
been ignoring me? Perhaps you should Google your name and mine ASAP
EH?
To: motomaniac333@gmail.com
?Please be advised that I will be out of office from Friday December
13th to Tuesday December 17th, returning Wednesday December 18th,
2019.
For urgent inquiries, please contact:
Amanda Lall at Bill.Blair.A2@parl.gc.ca
Regards,
Jessica
Jessica Bozzo
Constituency Assistant
Office of the Hon. Bill Blair
Member of Parliament, Scarborough Southwest
Email: Bill.Blair.C1@parl.gc.ca<mailto:Bill.Blair.C1@parl.gc.
Office: 416-261-8613<tel:416-261-8613>
---------- Original message ----------
From: David Amos <motomaniac333@gmail.com>
Date: Wed, 18 Dec 2019 12:26:24 -0400
Subject: YO Jesús A. Hernández-García Does your client Trevor Doyle
and the Canadian Government know that you have been ignoring me?
Perhaps you should Google your name and mine ASAP EH?
To: jesus_hernandez@fd.org, Elizabeth_Molina@fd.org,
washington.field@ic.fbi.gov, Boston.Mail@ic.fbi.gov,
rosa.e.rodriguez@usdoj.gov, ginette.milanes2@usdoj.gov,
Newsroom@globeandmail.com, news-tips@nytimes.com,
brian.donohue@usdoj.gov, mark.gallagher@usdoj.gov,
luis.rivera-santana@ic.fbi.gov, douglas.leff@ic.fbi.gov,
Larry.Tremblay@rcmp-grc.gc.ca, Gilles.Blinn@rcmp-grc.gc.ca,
Mark.Blakely@rcmp-grc.gc.ca, martin.gaudet@fredericton.ca,
frederictonnewsteam@bellmedia.
martine.turcotte@bell.ca, sylvie.gadoury@radio-canada.ca,
hadeel.ibrahim@cbc.ca, oigfoia@usdoj.gov, william.barr@usdoj.gov,
oldmaison@yahoo.com, andre@jafaust.com, Bill.Blair@parl.gc.ca,
bill.blair.c1@parl.gc.ca
Cc: david.raymond.amos333@gmail.
macpherson.don@dailygleaner.
---------- Forwarded message ----------
From: Bill.Blair.A1@parl.gc.ca
Date: Fri, 22 Nov 2019 16:01:43 +0000
Subject: Automatic reply: YO Gerry Butts at least Ralph Goodale's
replacement Bill Blair can never claim that he didn't know all about
my lawsuits on boths sides of the 49th EH?
To: david.raymond.amos333@gmail.
Thank you for your email.
As of August 2nd, 2019 I no longer work in the office of the Hon. Bill
Blair, Member of Parliament for Scarborough Southwest. For all office
inquiries, please contact Jessica Bozzo in our constituency office at
bill.blair.c1@parl.gc.ca or at 416-261-8613.
Thank you very much and have a pleasant day.
Sincerely,
Liam Kirkpatrick
---------- Original message ----------
From: Anthony.Rota@parl.gc.ca
Date: Sat, 14 Dec 2019 16:04:29 +0000
Subject: Automatic reply: Methinks YOU and Anthony Rota and the sneaky
lawyer Jody Wilson-Raybould should remember this email and the
document hereto attached N'esy Pas Gerald Butts?
To: motomaniac333@gmail.com
Hello,
Our office acknowledges receipt of your email.
Thank you for taking the time to contact my office. My staff and I are
here to assist everyone in Nipissing-Timiskaming with any Federal
Government issues, questions or concerns. In order for us to better
serve you, please provide us with your complete name, mailing address
(including the postal code), and a daytime and home phone number.
This information is kept confidential.
My team in Timiskaming Shores, North Bay and Ottawa and I appreciate
hearing from all constituents and rest assured that correspondence we
receive from residents of Nipissing-Timiskaming is reviewed and acted
upon.
Thank you, Miigwech
Anthony
------------------------------
Bonjour,
Par la pr?sente, nous accusons r?ception de votre courriel.
Merci d'avoir pris le temps de contacter mon bureau. Mon personnel et
moi sommes ? l'enti?re disposition des habitants de
Nipissing-Timiskaming pour tout probl?me, question ou pr?occupation
qu'ils peuvent avoir concernant le gouvernement f?d?ral. Pour nous
aider ? mieux vous servir, nous vous demandons de nous transmettre
votre nom au complet, votre adresse postale (y compris le code
postal), ainsi que votre num?ro de t?l?phone ? domicile et le num?ro
o? vous joindre le jour.
Ces renseignements demeurent confidentiels.
Les commentaires des ?lecteurs comptent beaucoup pour moi et pour les
membres de mon ?quipe dans les bureaux de Timiskaming Shores, de North
Bay et d'Ottawa, et soyez assur?s que la correspondance que nous
recevons des habitants de Nipissing-Timiskaming est examin?e et que
nous y donnons suite.
Merci, Miigwech
Anthony
Anthony Rota
Member of Parliament for Nipissing-Timiskaming | D?put? de Nipissing-Timiskaming
Assistant Deputy Speaker | Vice-pr?sident adjoint de la Chambre
Valour Building, Room 1020 | ?difice de la Bravoure, bureau 1020
Ottawa, Ontario K1A 0A6
Tel. | T?l. : (613) 995-6255
Fax | T?l?copieur : (613) 996-7993
Anthony.Rota@parl.gc.ca<
---------- Original message ----------
From: Newsroom <newsroom@globeandmail.com>
Date: Sat, 14 Dec 2019 16:04:52 +0000
Subject: Automatic reply: Methinks YOU and Anthony Rota and the sneaky
lawyer Jody Wilson-Raybould should remember this email and the
document hereto attached N'esy Pas Gerald Butts?
To: David Amos <motomaniac333@gmail.com>
Thank you for contacting The Globe and Mail.
If your matter pertains to newspaper delivery or you require technical
support, please contact our Customer Service department at
1-800-387-5400 or send an email to customerservice@globeandmail.
If you are reporting a factual error please forward your email to
publiceditor@globeandmail.com<
Letters to the Editor can be sent to letters@globeandmail.com
This is the correct email address for requests for news coverage and
press releases.
---------- Original message ----------
From: David Amos <motomaniac333@gmail.com>
Date: Sat, 14 Dec 2019 12:04:13 -0400
Subject: Methinks YOU and Anthony Rota and the sneaky lawyer Jody
Wilson-Raybould should remember this email and the document hereto
attached N'esy Pas Gerald Butts?
To: Anthony.Rota@parl.gc.ca, "Jody.Wilson-Raybould"
<Jody.Wilson-Raybould@parl.gc.
mcu@justice.gc.ca, david.hansen@justice.gc.ca, "jan.jensen"
<jan.jensen@justice.gc.ca>, david.mcguinty@parl.gc.ca,
steve.murphy@ctv.ca, Newsroom <Newsroom@globeandmail.com>, premier
<premier@ontario.ca>, PREMIER <PREMIER@gov.ns.ca>, premier
<premier@gnb.ca>, premier <premier@gov.ab.ca>, Office of the Premier
<scott.moe@gov.sk.ca>, premier <premier@leg.gov.mb.ca>
Cc: David Amos <david.raymond.amos333@gmail.
"Gerald.Butts" <Gerald.Butts@pmo-cpm.gc.ca>, andrew.scheer@parl.gc.ca,
geoff.regan@parl.gc.ca, geoff.regan.a1@parl.gc.ca, Geoff Regan
SpkrOff@parl.gc.ca
---------- Forwarded message ----------
From: David Amos <motomaniac333@gmail.com>
Date: Mon, 8 Feb 2016 16:31:38 -0400
Subject: Fwd: Attn Geoff Regan I called all three of your offices
again today and everybody played dumb as usual.
To: philt@stockwoods.ca
Cc: David Amos <david.raymond.amos@gmail.com>
---------- Forwarded message ----------
From: David Amos <motomaniac333@gmail.com>
Date: Mon, 8 Feb 2016 13:31:27 -0400
Subject: Attn Geoff Regan I called all three of your offices again
today and everybody played dumb as usual.
To: Geoff Regan <geoff@geoffregan.ca>, "heather.bradley"
<heather.bradley@parl.gc.ca>, SpkrOff@parl.gc.ca,
geoff.regan@parl.gc.ca, geoff.regan.a1@parl.gc.ca, Craig Munroe
<cmunroe@glgmlaw.com>, john.wallace@sen.parl.gc.ca, MulcaT
<MulcaT@parl.gc.ca>, "rona.ambrose.A1" <rona.ambrose.A1@parl.gc.ca>
Cc: David Amos <david.raymond.amos@gmail.com>
david.mcguinty@parl.gc.ca, Michael.Cooper@parl.gc.ca,
MP@michaelcoopermp.ca, "stephen.harper.a1"
<stephen.harper.a1@parl.gc.ca>
"steve.murphy" <steve.murphy@ctv.ca>
Hey Geoff Remember Mean Old Me?? I can't help but wonder if Mikey
Cooper does too..
I have been talking about you in Federal Court lately and you sent me
a letter aftter things got heat with your friend Judge Southcott
Correct??
Judge Bell Dec 14th
https://archive.org/details/
Judge Southcott Jan 11th
https://archive.org/details/
http://michaelcoopermp.ca/
Constituency Office Headquarters
20 Perron Street (Main Office) Suite 220
St Albert, Alberta T8N 1E4
E-mail: MP@michaelcoopermp.ca
Phone: 780-459-0809
Fax: 780-460-1246
http://geoffregan.ca/contact/
Hill Office:
Room 658, Confederation Building
House of Commons
Ottawa, Ontario K1A 0A6
Phone: (613) 996-3085
Fax: (613) 996-6988
E-mail: geoff.regan@parl.gc.ca
Constituency Office:
1496 Bedford Highway, Suite 222
Bedford, Nova Scotia B4A 1E5
Phone: (902) 426-2217
Fax: (902) 426-8339
E-mail: geoff@geoffregan.ca
Speaker’s Office:
Please direct correspondence for the Speaker of the House of Commons to:
E-mail: SpkrOff@parl.gc.ca
Heather Bradley Director of Communications
Office of the Speaker of the House of Commons
Tel: 613-992-5042
From: SpkrOff@parl.gc.ca
Sent: Tuesday, January 12, 2016 11:51 AM
To: david.raymond.amos@gmail.com
Subject: wondering if barred from all parliamentary properties in Canada
Dear Mr. Amos:
Please find attached a letter signed from the Speaker of the House of
Commons in response to your electronic message dated December 11,
2015.
Nicole Beaudin
Correspondence and Finance Officer, Speaker's Office/
Agent des finances et de la correspondance, La Présidence
Room 328-N, Centre Block/Pièce 328-N édifice du Centre
Ottawa, ON K1A 0A6
Tel.: 613-996-0630
For the Public Record once AGAIN I did NOT email anyone between Dec
7th and Dec 17th 2015
I tried to explain to your people on the phone today but they didn't
want to hear it but whereas I was not near the Internet for a period
of ten days I could not email anyone even if I wished to correct?
However I must inform you that before I dropped out of sight for a
while then appeared in Federal Court on the December the 14th I did
post my opinions of the election of the latest Speaker of the the
House within the CBC domain both BEFORE and after YOU Geof Regan won
the position of speaking on behalf of the Queen.
Clearly Canada's latest Speaker ignored me for nearly 12 years until I
mentioned YOU again in Federal Court on Dec 14th and Jan11th. Then YOU
were not long sending me the letter hereto attached the very next day
yet it was dated dated to the day after I talked the lawyer Craig
Munroe. Methinks you lawyer dudes held back the letter until you knew
how I made out with your old lawyer buddy from Halifax Judge Southcott
Nesy Pas?
None of you can't deny that ome of my statements still about YOUR
election as Speaker still exist within the CBC webpage today and
clearly I pointed to my appearance on Rogers TV.EH?
Please notice CBC deleted my first comment but when someone attacked a
comment that no longer was in the PUBLC view CBC allowed my next
comments to remain for over two months and counting.
http://www.cbc.ca/news/
Geoff Regan elected House Speaker as 42nd Parliament opens
MPs voted in a secret ballot, ranking the candidates by order of preference
By Susana Mas, CBC News Posted: Dec 03, 2015 10:07 AM ET Last Updated:
Dec 03, 2015 10:01 PM ET
David Amos
Content disabled.
@athooya Trust that Stevey Boy Harper and his old buddy Mr Mulcair got
the same email I sent the Boyz and Girlz in Red Coats as I reminded
the seasoned Librano lawyers Denis Paradis and Geoff Regan dicing with
Yasmin Ratansi and Brucy Stanton for the Speaker's chair of my lawsuit
in Federal Court.
Please enjoy
http://cas-cdc-www02.cas-satj.
Fredericton December 14, 2015
T-1557-15
DAVID RAYMOND AMOS v. HER MAJESTY THE QUEEN
(M-English)
Others - Crown (v. Queen) [Actions]
http://davidraymondamos3.
http://thedavidamosrant.
While they are voting for the record I predict Denis Paradis will win
the chair merely because he is from Quebec and Upper Canada has always
rules the roost when it comes to Libranos
My record has not been bad in that regard ask the mean old Librano
talkshow host Tommy Boy Young if ya dare EH Chucky Leblanc
Pray tell does anyone remember this conversation heard all over the
Maritimes just before Millikin got the job again and Bernie Lord and
Shawny Baby Graham followed my advice and whipped their followers into
picking the newly Independent Tanker to become a speaker in order to
shut him up?
Too Too funny indeed.
https://www.youtube.com/watch?
or if you wish to hear more
https://archive.org/details/
2 months ago 1 Like
MANY MORE COMMENTS AND THEN ONCE REGAN WAS ELECTED
Tenrager
@David Amos Your prediction was wrong, the rest is gibberish.
2 months ago 1 Like
David Amos
@Tenrager ROUND TWO If it was gibberish WHY did the CROWN Corp known
as CBC delete it ???
FYI Here is what I sent when I was wrong BTW You and CBC can bet that
I saved this webpage as well. N'esy Pas?
Trust that I don't mind being wrong about the choice of Speaker after
listening to the Senate reform plans I say WOW just like Geoff Regan
did when he commented that he was the first Speaker from the Maritimes
in nearly 100 years
Cc: Denis.Paradis@parl.gc.ca, Yasmin.Ratansi@parl.gc.ca,
bruce.stanton@parl.gc.ca, geoff@geoffregan.ca, geoff.regan@parl.gc.ca,
speakers.office@parliament.
MulcaT@parl.gc.ca, stephen.harper@parl.gc.ca,
andrew.scheer@parl.gc.ca, etc
Now everybody should view the three pdf files hereto attached. Clearly
my letters and many supporting documents were answered. More
importantly the Librano lawyer Joe Day should not deny that the brand
new Speaker Geoff Regan got the same pile of documents in 2004 while
he oversaw the Arar Inquiry on behalf of his old lawyer buddy Irwin
Cotler CORRECT?
Now I get to ask the important question to the brand new Speaker
before I file my next pile of documents in Federal Court (which will
obviously include the three attachments)
So Mr Speaker Geoff Regan am I sill barred from all Parliamentary
Properties in Canada or am I not???
Veritas Vincit
David Raymond Amos
902 800 0369
Fundy Royal, New Brunswick Debate – Federal Elections 2015 - The Local
Campaign, Rogers TV
https://www.youtube.com/watch?
Me and Louis Riel versus the RCMP
https://www.youtube.com/watch?
The dog in blue coat versus Gandalf
https://www.youtube.com/watch?
2 months ago 1 Like
Aron Axes
@athooya He's got a soar butt.
2 months ago 0 Likes
David Amos
HEY @Tenrager READ LINK THIS IF YOU DARE
http://www.checktheevidence.
Trust that Stevey Boy Harper and his old buddy Mr Mulcair got the same
email I sent the Boyz and Girlz in Red Coats as I reminded the
seasoned Librano lawyers Denis Paradis and Geoff Regan dicing with
Yasmin Ratansi and Brucy Stanton for the Speaker's chair of my lawsuit
in Federal Court.
Please enjoy
http://cas-cdc-www02.cas-satj.
Fredericton December 14, 2015
T-1557-15
DAVID RAYMOND AMOS v. HER MAJESTY THE QUEEN
(M-English)
Others - Crown (v. Queen) [Actions]
http://davidraymondamos3.
http://thedavidamosrant.
While they are voting for the record I predict Denis Paradis will win
the chair merely because he is from Quebec and Upper Canada has always
rules the roost when it comes to Libranos
My record has not been bad in that regard ask the mean old Librano
talkshow host Tommy Boy Young if ya dare EH Chucky Leblanc
Pray tell does anyone remember this conversation heard all over the
Maritimes just before Millikin got the job again and Bernie Lord and
Shawny Baby Graham followed my advice and whipped their followers into
picking the newly Independent Tanker to become a speaker in order to
shut him up?
Too Too funny indeed.
https://www.youtube.com/watch?
or if you wish to hear more
https://archive.org/details/
2 months ago 1 Like
ETC ETC ETC AND THE REST IS PARLIAMENTARY HISTORY N'ESY PAS MR TRUDEAU?
You can bet dimes to dollars that I save ALL the digital evidence of
all that I say and do just like my debate on Rogers TV. More
importantly I save all that is published about my Clan and I as well.
Here are two new blogs of the evil Zionist Mr Baconfat for his buddies
in the RCMP and the Canadian Forces to enjoy.
http://eateshite.blogspot.ca/
http://sunrayzulu.blogspot.ca/
Please notice Mr Baconfat and his blogging buddies Chucky Leblanc,
Glen Canning and Patty Baby Doran got this email as well and obviously
their heros within Frank Magazine have been mentioning Stevey Boy
Murphy and his ATV cohort Kayla Hounsell a lot lately EH?
Veritas Vincit
David Raymond Amos
902 800 0369
---------- Forwarded message ----------
From: David Amos <motomaniac333@gmail.com>
Date: Fri, 15 Jan 2016 16:15:03 -0400
Subject: Re: Re Federal Court Rule 46 (1) (a) (viii) as it applies to
my complaint (File No: T-1557-15) Trust that I called and tried to
talk a lot bureaucrats and politicians etc before sharing the hearings
held on Dec 14th and Jan 11th
To: david.mcguinty@parl.gc.ca
Cc: David Amos <david.raymond.amos@gmail.com>
Thank you for being ethical.
Best Regards
Dave
On 1/15/16, david.mcguinty@parl.gc.ca <david.mcguinty@parl.gc.ca> wrote:
> Received. Thank you.
> ______________________________
> From: David Amos <motomaniac333@gmail.com>
> Sent: January 15, 2016 2:22 PM
> To: McGuinty, David - M.P.; McKay, John - M.P.; Long, Wayne - Riding 1;
> McKenna, Catherine - M.P.; McCrimmon, Karen - Riding 1; Ludwig, Karen -
> Riding 2; karen.ludwig.nb; MacKinnon, Steven - Député
> Cc: David Amos
> Subject: Fwd: Re Federal Court Rule 46 (1) (a) (viii) as it applies to my
> complaint (File No: T-1557-15) Trust that I called and tried to talk a lot
> bureaucrats and politicians etc before sharing the hearings held on Dec 14th
> and Jan 11th
>
> ---------- Forwarded message ----------
> From: David Amos <motomaniac333@gmail.com>
> Date: Thu, 14 Jan 2016 16:29:14 -0400
> Subject: Re Federal Court Rule 46 (1) (a) (viii) as it applies to my
> complaint (File No: T-1557-15) Trust that I called and tried to talk a
> lot bureaucrats and politicians etc before sharing the hearings held
> on Dec 14th and Jan 11th
> To: Rheal.Fortin.c1@parl.gc.ca, Murray.Rankin.c1@parl.gc.ca,
> cmunroe@glgmlaw.com, nbd_cna@liberal.ca, pm <pm@pm.gc.ca>,
> ljulien@liberal.ca, pmilliken <pmilliken@cswan.com>, bdysart
> <bdysart@smss.com>, bdysart <bdysart@stewartmckelvey.com>,
> Braeden.Caley@vancouver.ca, robert.m.schuett@schuettlaw.
> jda@nf.aibn.com, eclark@coxandpalmer.com, office@liberal.ns.ca,
> president@lpco.ca, david@lpcm.ca, emerchant
> <emerchant@merchantlaw.com>, info@fja-cmf.gc.ca, w.kinew@uwinnipeg.ca,
> richard.tardif@cas-satj.gc.ca, "andrew.scheer"
> <andrew.scheer@parl.gc.ca>, john.wallace@sen.parl.gc.ca, MulcaT
> <MulcaT@parl.gc.ca>, "rona.ambrose.A1" <rona.ambrose.A1@parl.gc.ca>,
> RBauer <RBauer@perkinscoie.com>, sshimshak@paulweiss.com,
> cspada@lswlaw.com, msmith <msmith@svlaw.com>, bginsberg
> <bginsberg@pattonboggs.com>, "gregory.craig"
> <gregory.craig@skadden.com>, "Gilles.Blinn"
> <Gilles.Blinn@rcmp-grc.gc.ca>, "bob.paulson"
> <bob.paulson@rcmp-grc.gc.ca>, "bob.rae"
> <bob.rae@rogers.blackberry.net
> <Gilles.Moreau@rcmp-grc.gc.ca>
> <Stephane.vaillancourt@rcmp-
> Cc: David Amos <david.raymond.amos@gmail.com>
> Chantal.Carbonneau@cas-satj.
> assistance@liberal.ca, Karine Fortin <info@ndp.ca>, "stephen.harper"
> <stephen.harper.a1@parl.gc.ca>
>
> Anyway at least nobody said I could not so enjoy.
>
> Judge Bell Dec 14th
>
> https://archive.org/details/
>
> Judge Southcott Jan 11th
>
> https://archive.org/details/
>
>
> Federal Court Rule
>
> 46 (1) Subject to the approval of the Governor in Council and subject
> also to subsection (4), the rules committee may make general rules and
> orders
>
> (a) for regulating the practice and procedure in the Federal Court of
> Appeal and in the Federal Court, including, without restricting the
> generality of the foregoing,
>
> (viii) rules governing the recording of proceedings in the course of a
> hearing and the transcription of that recording,
>
>
> FOR IMMEDIATE RELEASE
>
> OTTAWA, January 7, 2016
>
> In response to recent media reports regarding the application of Order
> in Council PC 2015-1071, the Chief Administrator of the Courts
> Administration Service (CAS) is releasing the following statement on
> behalf of the Chief Justices of the Federal Court of Appeal, the
> Federal Court, the Court Martial Appeal Court of Canada and the Tax
> Court of Canada:
>
> The Chief Justices share the position conveyed today by the Chief
> Justice of Canada. They are also encouraged by the federal
> government’s response to their concerns about the impact of this Order
> in Council on judicial independence and are expecting a satisfactory
> resolution of the issue shortly.
>
> For further information contact:
> Richard Tardif
> Deputy Chief Administrator
> Judicial and Registry Services
> Courts Administration Service
> richard.tardif@cas-satj.gc.ca
> Tel: 613-943-3458
>
> http://goc411.ca/Employees/
>
> Daniel Gosselin
> Chief Administrator:
> Courts Administration Service
> Principal Office
> 90 Sparks St.
> Ottawa, Ontario K1A 0H9
> Phone: 613-996-4778
> Fax: 613-941-6197
> Email: daniel.gosselin@cas-satj.gc.ca
>
> The clerks above did not have the sand to call me back but the lawyer
> below certainly did. I hung up on her the instant she told me
> everybody was too busy
> to bother talking to me.
>
> http://goc411.ca/60585/Lise-
>
> Lise Henrie
> Executive Directer and General Counsel
> 613-943-5484
>
>
> ---------- Forwarded message ----------
> From: David Amos <david.raymond.amos@gmail.com>
> Date: Thu, 19 Nov 2015 14:55:21 -0400
> Subject: Fwd: Attt Commissioner William A. Brooks id you wish to
> recall I have some old documents for you and many foreign judges to
> review ASAP
> To: heather.bradley@parl.gc.ca, "andrew.scheer"
> <andrew.scheer@parl.gc.ca>, john.wallace@sen.parl.gc.ca
> Cc: David Amos <motomaniac333@gmail.com>, bdysart
> <bdysart@stewartmckelvey.com>
>
> I just called both of you again
>
> Heather Bradley, Director of Communications, Office of the Speaker of the
> House of Commons:
> Telephone: 613-995-7882
> E-mail: heather.bradley@parl.gc.ca
>
>
> John D. Wallace - Independent
>
> Province:
> New Brunswick
> Senatorial Designation:
> Rothesay
> Appointed on the advice of: Harper (C)
> Telephone: 613-947-4240 or 1-800-267-7362
> Fax: 613-947-4252
> Email: john.wallace@sen.parl.gc.ca
>
> ---------- Forwarded message ----------
> From: David Amos <motomaniac333@gmail.com>
> Date: Fri, Nov 13, 2015 at 4:00 PM
> Subject: Attt Commissioner William A. Brooks id you wish to recall I have
> some old documents for you and many foreign judges to review ASAP
> To: info@fja-cmf.gc.ca, pm <pm@pm.gc.ca>, pmilliken <pmilliken@cswan.com>,
> MulcaT <MulcaT@parl.gc.ca>, "rona.ambrose.A1" <rona.ambrose.A1@parl.gc.ca>
> Cc: David Amos <david.raymond.amos@gmail.com>
>
>
> Welcome to the Website of the Office of the Commissioner for Federal
> Judicial Affairs Canada
>
> The Commissioner for Federal Judicial Affairs reports directly to the
> Minister of Justice. The Office of the Commissioner was established in
> 1978 to safeguard the independence of the judiciary and provide
> federally appointed judges with administrative services independent of
> the Department of Justice.
>
> Duties and responsibilities include:
>
> administering Part I of the Judges Act, which deals with
> eligibility for appointment, retirement age, and salaries of federally
> appointed judges;
>
> preparing a budget and providing services and staff to the
> Canadian Judicial Council;
>
> managing the Judicial Appointments Secretariat, which administers
> 17 advisory committees responsible for evaluating candidates for
> federal judicial appointment. The Minister of Justice has also
> mandated FJA to administer the process for the most recent
> appointments to the Supreme Court of Canada;
>
> managing the Federal Courts Reports Section, which is responsible
> for selecting and publishing Federal Court of Appeal and Federal Court
> decisions in both official languages;
>
> administering a judicial intranet called JUDICOM, which provides
> judges with email, a secure and restricted communication system, and a
> virtual library;
>
> providing language training to judges in both official languages;
>
> coordinating initiatives related to the Canadian judiciary's role
> in international cooperation.
>
> In order to carry out these activities and provide services to
> approximately 1,100 active judges and 850 retired judges and their
> survivors in Canada, the Commissioner is assisted by the Deputy
> Commissioner, six Directors and, at present, 70 other staff members.
>
> This Web site is designed to inform all Canadians about FJA's role and
> activities in judicial affairs in Canada. We welcome any requests for
> information and any comments or suggestions. Please do not hesitate to
> Contact Us.
>
> Enjoy your visit to our site!
>
> William A. Brooks, Commissioner
> Federal Judicial Affairs Canada, Office of the Commissioner for
> 8th Flr., 99 Metcalfe St.
> Ottawa, Ontario K1A 1E3
> Phone: 613-995-5140
> Fax: 613-995-5615
> info@fja-cmf.gc.ca,
>
> http://opendatacanada.com/
>
> William A. Brooks works as Commissioner (Commissaire) in
> COMMISSIONER'S OFFICE (BUREAU DU COMMISSAIRE), Office of the
> Commissioner for Federal Judicial Affairs Canada (Commissariat à la
> magistrature fédérale Canada). The telephone number is 613-947-1793.
> The address is 99 Metcalfe Street, 8th Floor, Ottawa, Ontario K1A 1E3.
>
> In 1996, Federal Judicial Affairs (FJA) was given the responsibility
> by the Chief Justice of Canada and the Federal Minister of Justice to
> coordinate the involvement of the Canadian judiciary in international
> technical cooperation initiatives. The Commissioner for FJA thus
> represents the principal instrument of intervention in the
> international judicial arena on behalf of the federal government, the
> Minister of Justice and the Canadian Judicial Council, ensuring that
> their participation in international activities does not compromise
> judicial independence and impartiality. The Commissioner is supported
> in the discharge of these responsibilities by the Judicial Advisory
> Committee on International Engagement.
>
> Since its inception and with the professional contributions of members
> of the judicial community, judicial experts and Canadian institutional
> partners, the International Programs Division (IPD) has implemented
> numerous international judicial cooperation activities and coordinated
> the participation of Canadian experts to that end. IPD is guided by
> the Canadian Judicial Council Policy on International Judicial
> Activities.
>
> http://www.cjc-ccm.gc.ca/
>
>
> Canadian Partners
> A collage of 5 color photographs features Canadian and foreign judges
> and court administrators at international conferences and meetings,
> including the Legal Empowerment of the Poor Roundtable meetings held
> across Canada.
>
> Canadian organizations partnering with or providing support and
> assistance to the International Programs Division of Federal Judicial
> Affairs in its projects have included:
>
> Court Administration Service
> Supreme Court of Canada
> Attorney General of Ontario
> Canadian Department of Justice
> Canadian Superior Courts Judges Association
> National Judicial Institute
> Canadian Institute for the Administration of Justice
>
>
>
>
> ---------- Forwarded message ----------
> From: David Amos <motomaniac333@gmail.com>
> Date: Wed, 23 Sep 2015 09:35:01 -0400
> Subject: RE My complaint against the CROWN in Federal Court Attn David
> Hansen and Peter MacKay If you planning to submit a motion for a
> publication ban on my complaint trust that you dudes are way past too
> late
> To: David.Hansen@justice.gc.ca, "peter.mackay"
> <peter.mackay@justice.gc.ca>, "peacock.kurt"
> <peacock.kurt@
> <mclaughlin.heather@
> <david.akin@sunmedia.ca>, "robert.frater"
> <robert.frater@justice.gc.ca>, paul.riley@ppsc-sppc.gc.ca,
> greg@gregdelbigio.com, joyce.dewitt-vanoosten@gov.bc.
> joan.barrett@ontario.ca, jean-vincent.lacroix@gouv.qc.
> peter.rogers@mcinnescooper.com
> Cc: David Amos <david.raymond.amos@gmail.com>
> <gopublic@cbc.ca>, Whistleblower <Whistleblower@ctv.ca>
>
> https://scc-csc.lexum.com/scc-
>
> http://www.scc-csc.gc.ca/
>
> http://thedavidamosrant.
>
> I repeat what the Hell do I do with the Yankee wiretapes taps sell
> them on Ebay or listen to them and argue them with you dudes in
> Feferal Court?
>
> Petey Baby loses all arliamentary privelges in less than a month but
> he still suposed to be an ethical officer of the Court CORRECT?
>
> Veritas Vincit
> David Raymond Amos
> 902 800 0369
>
> ---------- Forwarded message ----------
> From: David Amos <david.raymond.amos@gmail.com>
> Date: Tue, 22 Nov 2011 12:32:30 -0400
> Subject: Andre meet Biil Csapo of Occupy Wall St He is a decent fellow
> who can be reached at (516) 708-4777 Perhaps you two should talk ASAP
> To: wcsapo <wcsapo@gmail.com>
> Cc: occupyfredericton <occupyfredericton@gmail.com>
>
> From: David Amos <david.raymond.amos@gmail.com>
> Subject: Your friends in Corridor or the Potash Corp or Bruce Northrup
> or the RCMP should have told you about this stuff not I
> To: "khalid" <khalid@windsorenergy.ca>, "Wayne.Lang"
> <Wayne.Lang@rcmp-grc.gc.ca>, "bruce.northrup@gnb.ca"
> <bruce.northrup@gnb.ca>, "oldmaison@yahoo.com" <oldmaison@yahoo.com>,
> "thenewbrunswicker" <thenewbrunswicker@gmail.com>, "chiefape"
> <chiefape@gmail.com>, "danfour" <danfour@myginch.com>, "evelyngreene"
> <evelyngreene@live.ca>, "Barry.MacKnight"
> <Barry.MacKnight@fredericton.
> <tom_alexander@swn.com>
> Cc: "thepurplevioletpress" <thepurplevioletpress@gmail.
> "maritime_malaise" <maritime_malaise@yahoo.ca>
> Date: Tuesday, November 15, 2011, 4:16 PM
>
>
> http://www.archive.org/
>
> http://www.archive.org/
>
> http://davidamos.blogspot.com/
>
> FEDERAL EXPRES February 7, 2006
> Senator Arlen Specter
> United States Senate
> Committee on the Judiciary
> 224 Dirksen Senate Office Building
> Washington, DC 20510
>
> Dear Mr. Specter:
>
> I have been asked to forward the enclosed tapes to you from a man
> named, David Amos, a Canadian citizen, in connection with the matters
> raised in the attached letter. Mr. Amos has represented to me that
> these are illegal
> FBI wire tap tapes. I believe Mr. Amos has been in contact with you
> about this previously.
>
> Very truly yours,
> Barry A. Bachrach
> Direct telephone: (508) 926-3403
> Direct facsimile: (508) 929-3003
> Email: bbachrach@bowditch.com
>
>
>
> ---------- Forwarded message ----------
> From: David Amos <motomaniac333@gmail.com>
> Date: Sat, 17 Nov 2012 14:10:14 -0400
> Subject: Yo Mr Bauer say hey to your client Obama and his buddies in
> the USDOJ for me will ya?
> To: RBauer <RBauer@perkinscoie.com>, sshimshak@paulweiss.com,
> cspada@lswlaw.com, msmith <msmith@svlaw.com>, bginsberg
> <bginsberg@pattonboggs.com>, "gregory.craig"
> <gregory.craig@skadden.com>, pm <pm@pm.gc.ca>, "bob.paulson"
> <bob.paulson@rcmp-grc.gc.ca>, "bob.rae"
> <bob.rae@rogers.blackberry.net
> <leader@greenparty.ca>
> Cc: alevine@cooley.com, David Amos <david.raymond.amos@gmail.com>
> michael.rothfeld@wsj.com, remery@ecbalaw.com
>
> QSLS Politics
> By Location Visit Detail
> Visit 29,419
> Domain Name usdoj.gov ? (U.S. Government)
> IP Address 149.101.1.# (US Dept of Justice)
> ISP US Dept of Justice
> Location Continent : North America
> Country : United States (Facts)
> State : District of Columbia
> City : Washington
> Lat/Long : 38.9097, -77.0231 (Map)
> Language English (U.S.) en-us
> Operating System Microsoft WinXP
> Browser Internet Explorer 8.0
> Mozilla/4.0 (compatible; MSIE 8.0; Windows NT 5.1; Trident/4.0; .NET
> CLR 2.0.50727; .NET CLR 3.0.4506.2152; .NET CLR 3.5.30729; InfoPath.2;
> DI60SP1001)
> Javascript version 1.3
> Monitor Resolution : 1024 x 768
> Color Depth : 32 bits
> Time of Visit Nov 17 2012 6:33:08 pm
> Last Page View Nov 17 2012 6:33:08 pm
> Visit Length 0 seconds
> Page Views 1
> Referring URL http://www.google.co...
> Search Engine google.com
> Search Words david amos bernie madoff
> Visit Entry Page http://qslspolitics....-wendy-
> Visit Exit Page http://qslspolitics....-wendy-
> Out Click
> Time Zone UTC-5:00
> Visitor's Time Nov 17 2012 12:33:08 pm
> Visit Number 29,419
>
> http://qslspolitics.blogspot.
>
>> ----- Original Message -----
>> From: "David Amos" <david.raymond.amos@gmail.com>
>> To: "Rob Talach" <rtalach@ledroitbeckett.com>
>> Sent: Tuesday, June 12, 2012 10:59 PM
>> Subject: Re: Attn Robert Talach and I should talk ASAP about my suing
>> the Catholic Church Trust that Bastarache knows why
>>
>> The date stamp on about page 134 of this old file of mine should mean
>> a lot to you
>>
>> http://www.checktheevidence.
>>
>> ---------- Forwarded message ----------
>> From: David Amos <motomaniac333@gmail.com>
>> Date: Wed, 21 Nov 2012 15:37:08 -0400
>> Subject: To Hell with the KILLER COP Gilles Moreau What say you NOW
>> Bernadine Chapman??
>> To: Gilles.Moreau@rcmp-grc.gc.ca, phil.giles@statcan.ca,
>> maritme_malaise@yahoo.ca, Jennifer.Nixon@ps-sp.gc.ca,
>> bartman.heidi@psic-ispc.gc.ca, Yves.J.Marineau@rcmp-grc.gc.ca
>> david.paradiso@erc-cee.gc.ca, desaulniea@smtp.gc.ca,
>> denise.brennan@tbs-sct.gc.ca, anne.murtha@vac-acc.gc.ca, webo
>> <webo@xplornet.com>, julie.dickson@osfi-bsif.gc.ca,
>> rod.giles@osfi-bsif.gc.ca, flaherty.j@parl.gc.ca, toewsv1
>> <toewsv1@parl.gc.ca>, "Nycole.Turmel" <Nycole.Turmel@parl.gc.ca>,
>> Clemet1 <Clemet1@parl.gc.ca>, maritime_malaise
>> <maritime_malaise@yahoo.ca>, oig <oig@sec.gov>, whistleblower
>> <whistleblower@finra.org>, whistle <whistle@fsa.gov.uk>, david
>> <david@fairwhistleblower.ca>
>> Cc: j.kroes@interpol.int, David Amos <david.raymond.amos@gmail.com>
>> bernadine.chapman@rcmp-grc.gc.
>> <justin.trudeau.a1@parl.gc.ca>
>> <Juanita.Peddle@rcmp-grc.gc.ca
>> "Wayne.Lang" <Wayne.Lang@rcmp-grc.gc.ca>, "Robert.Trevors"
>> <Robert.Trevors@gnb.ca>, "ian.fahie" <ian.fahie@rcmp-grc.gc.ca>
>>
>> http://www.rcmp-grc.gc.ca/nb/
>>
>> http://nb.rcmpvet.ca/
>>
>> From: Gilles Moreau <Gilles.Moreau@rcmp-grc.gc.ca>
>> Date: Wed, 21 Nov 2012 08:03:22 -0500
>> Subject: Re: Lets ee if the really nasty Newfy Lawyer Danny Boy
>> Millions will explain this email to you or your boss Vic Toews EH
>> Constable Peddle???
>> To: David Amos <motomaniac333@gmail.com>
>>
>> Please cease and desist from using my name in your emails.
>>
>> Gilles Moreau, Chief Superintendent, CHRP and ACC
>> Director General
>> HR Transformation
>> 73 Leikin Drive, M5-2-502
>> Ottawa, Ontario K1A 0R2
>>
>> Tel 613-843-6039
>> Cel 613-818-6947
>>
>> Gilles Moreau, surintendant principal, CRHA et ACC
>> Directeur général de la Transformation des ressources humaines
>> 73 Leikin, pièce M5-2-502
>> Ottawa, ON K1A 0R2
>>
>> tél 613-843-6039
>> cel 613-818-6947
>> gilles.moreau@rcmp-grc.gc.ca
>>
>>>>> David Amos <motomaniac333@gmail.com> 2012-11-21 00:01 >>>
>
> Could ya tell I am investigating your pension plan bigtime? Its
> because no member of the RCMP I have ever encountered has earned it
> yet
>
> ---------- Forwarded message ----------
> From: David Amos <motomaniac333@gmail.com>
> Date: Wed, 21 Nov 2012 00:46:06 -0400
> Subject: This is a brief as I can make my concerns Cst Peddle ask the
> nasty Newfy lawyer Tommy Boy Marshall why that is
> To: "Wayne.Lang" <Wayne.Lang@rcmp-grc.gc.ca>, toewsv1
> <toewsv1@parl.gc.ca>, georgemurphy@gov.nl.ca, tosborne@gov.nl.ca,
> william.baer@usdoj.gov, randyedmunds@gov.nl.ca, yvonnejones@gov.nl.ca,
> gerryrogers@gov.nl.ca
> Cc: Juanita.Peddle@rcmp-grc.gc.ca, tommarshall@gov.nl.ca,
> "bob.paulson" <bob.paulson@rcmp-grc.gc.ca>, David Amos
> <david.raymond.amos@gmail.com>
>
> ---------- Forwarded message ----------
> From: David Amos <motomaniac333@gmail.com>
> Date: Mon, 19 Nov 2012 11:36:04 -0400
> Subject: This is a brief as I can make my concerns Randy
> To: randyedmunds <randyedmunds@gov.nl.ca>
> Cc: David Amos <david.raymond.amos@gmail.com>
>
> In a nutshell my concerns about the actions of the Investment Industry
> affect the interests of every person in every district of every
> country not just the USA and Canada. I was offering to help you with
> Emera because my work with them and Danny Williams is well known and
> some of it is over eight years old and in the PUBLIC Record.
>
> All you have to do is stand in the Legislature and ask the MInister of
> Justice why I have been invited to sue Newfoundland by the
> Conservatives
>
>
> Obviously I am the guy the USDOJ and the SEC would not name who is the
> link to Madoff and Putnam Investments
>
> Here is why
>
> http://banking.senate.gov/
>
> Notice the transcripts and webcasts of the hearing of the US Senate
> Banking Commitee are still missing? Mr Emory should at least notice
> Eliot Spitzer and the Dates around November 20th, 2003 in the
> following file
>
> http://www.checktheevidence.
>
> http://occupywallst.org/users/
>
>
> ---------- Forwarded message ----------
> From: "Hansen, David" <David.Hansen@justice.gc.ca>
> Date: Thu, 1 Aug 2013 19:28:44 +0000
> Subject: RE: I just called again Mr Hansen
> To: David Amos <motomaniac333@gmail.com>
>
> Hello Mr. Amos,
>
> I manage the Justice Canada civil litigation section in the Atlantic
> region. We are only responsible for litigating existing civil
> litigation files in which the Attorney General of Canada is a named
> defendant or plaintiff. If you are a plaintiff or defendant in an
> existing civil litigation matter in the Atlantic region in which
> Attorney General of Canada is a named defendant or plaintiff please
> provide the court file number, the names of the parties in the action
> and your question. I am not the appropriate contact for other
> matters.
>
> Thanks
>
> David A. Hansen
> Regional Director | Directeur régional
> General Counsel |Avocat général
> Civil Litigation and Advisory | Contentieux des affaires civiles et
> services de consultation
> Department of Justice | Ministère de la Justice
> Suite 1400 – Duke Tower | Pièce 1400 – Tour Duke
> 5251 Duke Street | 5251 rue Duke
> Halifax, Nova Scotia | Halifax, Nouvelle- Écosse
> B3J 1P3
> david.hansen@justice.gc.ca
> Telephone | Téléphone (902) 426-3261 / Facsimile | Télécopieur (902)
> 426-2329
> This e-mail is confidential and may be protected by solicitor-client
> privilege. Unauthorized distribution or disclosure is prohibited. If
> you have received this e-mail in error, please notify us and delete
> this entire e-mail.
> ?Before printing think about the Environment
> Thinking Green, please do not print this e-mail unless necessary.
> Pensez vert, svp imprimez que si nécessaire.
>
>
>
>
> -----Original Message-----
> From: David Amos [mailto:motomaniac333@gmail.
> Sent: August 1, 2013 12:04 PM
> To: justmin; Hansen, David; macpherson.don; stoffp1
> Cc: David Amos; justin.trudeau.a1; leader
> Subject: I just called again Mr Hansen
>
> David,Hansen,
> Justice Canada,
> Halifax, Nova Scotia,
> B3J 1P3.
> Phone: 902-426-3261.
> Fax: 902-426-2329.
> Email: david.hansen@justice.gc.ca
>
> ---------- Forwarded message ----------
> From: "Hansen, David" <David.Hansen@justice.gc.ca>
> Date: Tue, 9 Jun 2015 18:19:29 +0000
> Subject: Automatic reply: Re Election Canada and hard copy and emails
> sent to them and the RCMP and my calls,Duncan Toswell and
> Ronald.Lamothe just now
> To: David Amos <motomaniac333@gmail.com>
>
> I am currently away from the office. Please contact Ginette Mazerolle
> if you require assistance.
>
>
> ---------- Forwarded message ----------
> From: "Hansen, David" <David.Hansen@justice.gc.ca>
> Date: Mon, 11 Aug 2014 18:46:27 +0000
> Subject: Automatic reply: RE My calls to Jim Prentice, Mike Duffy's
> lawyer and your Ministries please find hereto attached some of the PDF
> files I promised before I argue the CROWN in Federal Court
> To: David Amos <motomaniac333@gmail.com>
>
> I will be away from the office from August 1st to September 2nd.
> Please contact Ginette Mazerolle if you require assistance.
>
>
> ---------- Forwarded message ----------
> From: David Amos <david.raymond.amos@gmail.com>
> Date: Mon, 21 Sep 2015 14:55:29 -0300
> Subject: Fwd: Here is my latest complaint about the SEC, Banksters and
> Taxmen
> To: hbrady@berkeley.edu, gsppdean@berkeley.edu, swinfo@scottwalker.com
> Cc: David Amos <motomaniac333@gmail.com>
>
> Henry E. Brady
>
> Goldman School Dean
> Class of 1941 Monroe Deutsch Professor of Political Science and Public
> Policy
> 103 GSPP Main
> hbrady@berkeley.edu
> <javascript:void(location.
> '+String.fromCharCode(104,98,
> gsppdean@berkeley.edu
> <javascript:void(location.
> '+String.fromCharCode(103,115,
>
> *Assistant: Beth McCleary*
> (510) 642-5116
> *Email Beth McCleary*
> <javascript:void(location.
> '+String.fromCharCode(98,109,
>
> ---------- Forwarded message ----------
> From: David Amos <david.raymond.amos@gmail.com>
> Date: Fri, Sep 18, 2015 at 4:34 PM
> Subject: Fwd: Here is my latest complaint about the SEC, Banksters and
> Taxmen
> To: jmwilson@mta.ca, alaina@alainalockhart.ca,
> stephanie.coburn@greenparty.ca
> Cc: David Amos <motomaniac333@gmail.com>
>
>
> http://james4fundyroyal.
>
> https://alainalockhart.
>
>
> http://www.greenparty.ca/en/
>
>
> ---------- Forwarded message ----------
> From: David Amos <david.raymond.amos@gmail.com>
> Date: Fri, Sep 18, 2015 at 4:16 PM
> Subject: Fwd: Here is my latest complaint about the SEC, Banksters and
> Taxmen
> To: Saint Croix Courier <editor@stcroixcourier.ca>, Duncan Matheson <
> duncan@bissettmatheson.com>, infoacadie@radio-canada.ca
> Cc: David Amos <motomaniac333@gmail.com>
>
>
> *
> https://player.fm/series/
> <
> https://player.fm/series/
>>*
>
> Michelle LeBlanc, Vern Faulkner and Duncan Matheson look at the big
> political stories of the week. - See more at:
> https://player.fm/series/
>
> https://twitter.com/mleblanc_
> Keep up with Duncan
>
> 506-457-1627
>
>
> *Editor:* Vern Faulkner
> Phone: (506) 466-3220 ext. 1307; CELL (506) 467-5203
> Email: editor@stcroixcourier.ca
>
>
> ---------- Forwarded message ----------
> From: David Amos <david.raymond.amos@gmail.com>
> Date: Fri, 18 Sep 2015 10:18:04 -0300
> Subject: Fwd: Here is my latest complaint about the SEC, Banksters and
> Taxmen
> To: nicolas@allvotes.ca, pm <pm@pm.gc.ca>, brendan@brendanmiles.ca
> Cc: David Amos <motomaniac333@gmail.com>, Tim.Moen@libertarian.ca,
> info@
>
> ENJOY
>
> https://www.scribd.com/doc/
>
> https://www.scribd.com/doc/
>
>
>
>
>
> ---------- Forwarded message ----------
> From: David Amos <motomaniac333@gmail.com>
> Date: Wed, 6 Jan 2016 18:22:05 -0400
> Subject: Re Federal Court File No: T-1557-15 Did you order Harper and
> the NDP to ignore me as well???
> To: Liberal / Assistance <nbd_cna@liberal.ca>, cmunroe@glgmlaw.com, pm
> <pm@pm.gc.ca>, "justin.trudeau.a1" <justin.trudeau.a1@parl.gc.ca>
> <mcu@justice.gc.ca>
> Cc: David Amos <david.raymond.amos@gmail.com>
>
> How about Dizzy Lizzy May and the Bloc?
>
> On 1/6/16, Cmunroe (Liberal / Assistance) <nbd_cna@liberal.ca> wrote:
>
> ---------- Original message ----------
> From: "Cmunroe (Liberal / Assistance)" <nbd_cna@liberal.ca>
> Date: Wed, 06 Jan 2016 19:28:25 +0000
> Subject: Re: Attn Dr. John Gillis Re Federal Court File No: T-1557-15
> Trust that I called and tried to reason with a lot of Liberals begore
> I am before the cour...
> To: Motomaniac333 <motomaniac333@gmail.com>
>
> RealChange.ca | DuVraiChangement.ca
>
> ------------------------------
>
> Cmunroe, Jan 6, 14:28
>
> Hello all,
>
> I would ask that you please do not respond to this e-mail (in the
> event that you were inclined to do so.)
>
> Let me know if you have any questions or concerns.
>
> Regards,
>
> Craig Munroe
> (Party Legal and Constitutional Advisor)
>
> -----Original Message-----
> From: David Amos [mailto:motomaniac333@gmail.
> Sent: Wednesday, January 06, 2016 11:09 AM
> To: Craig Munroe <cmunroe@glgmlaw.com>; nbd_cna@liberal.ca; pm
> <pm@pm.gc.ca>; ljulien@liberal.ca; pmilliken <pmilliken@cswan.com>;
> bdysart <bdysart@smss.com>; bdysart <bdysart@stewartmckelvey.com>;
> Braeden.Caley@vancouver.ca; robert.m.schuett@schuettlaw.
> jda@nf.aibn.com; eclark@coxandpalmer.com; office@liberal.ns.ca;
> president@lpco.ca; david@lpcm.ca; emerchant@merchantlaw.com
> Cc: David Amos <david.raymond.amos@gmail.com>
> Karine Fortin <info@ndp.ca>; stephen.harper
> <stephen.harper.a1@parl.gc.ca>
> Subject: Re: Attn Dr. John Gillis Re Federal Court File No: T-1557-15
> Trust that I called and tried to reason with a lot of Liberals begore
> I am before the court again on Monday Jan 11th
>
> On 1/6/16, David Amos <motomaniac333@gmail.com> wrote:
>> BTW the nice guys who talked to me and didn't dismiss me I put in the
>> BCC line
>>
>> Dr. John Gillis
>> P.O. Box 723
>> 5151 George Street, Suite 1400
>> Halifax, Nova Scotia
>> Canada B3J 2T3
>> Tel: (902) 429-1993
>> Email: office@liberal.ns.ca
>>
>> John Allan, President
>> Liberal Party of Newfoundland & Labrador
>> T: (709) 685-1230
>> jda@nf.aibn.com
>>
>>
>> Braeden Caley
>> Office of the Mayor, City of Vancouver
>> 604-809-9951
>> Braeden.Caley@vancouver.ca,
>>
>>
>> Britt Dysart QC
>> Suite 600, Frederick Square
>> 77 Westmorland Street
>> P.O. Box 730
>> Fredericton, NB, Canada
>> E3B 5B4
>>
>> P 506.443.0153
>> F 506.443.9948
>>
>>
>> Evatt F. A. Merchant
>> Merchant Law Group LLP
>> First Nations Bank Bldg.
>> 501-224 4th Ave. S.
>> Saskatoon, Saskatchewan S7K 5M5
>> Phone: 306-653-7777
>> Email: emerchant@merchantlaw.com
>>
>>
>> Ewan W. Clark
>> Montague
>> Phone: (902) 838-5275
>> Fax: (902) 838-3440
>> eclark@coxandpalmer.com
>>
>> Robert M. Schuett
>> #200, 602 11th Avenue SW
>> Calgary Alberta T2R 1J8
>> Phone: (403) 705-1261
>> Fax: (403) 705-1265
>> robert.m.schuett@schuettlaw.
>>
>>
>> http://www.liberal.ca/
>>
>> Who are we?
>>
>> We are volunteers from across the country who care passionately about
>> Canada’s future and promoting Liberal values. We are community
>> leaders, parents, and professionals who volunteer our time in this
>> role. The board works together to provide oversight and guidance to
>> the Party in matters both fiduciary, and strategic. We meet regularly
>> in person and by phone with the objective of ensuring the Party is
>> prepared for the next federal election. It is an honour to work with
>> such a distinct and talented group of individuals. Please don’t
>> hesitate to reach out to us at nbd_cna@liberal.ca.
>> Anna Gainey
>>
>> President, Liberal Party of Canada
>>
>> T @annamgainey
>> Leader Justin Trudeau
>> National President Anna Gainey
>> Acting National Director Christina Topp
>> National Vice-President (English) Chris MacInnes
>> National Vice-President (French) Marie Tremblay
>> National Policy Chair Maryanne Kampouris
>> National Membership Secretary Leanne Bourassa
>> Past National President Mike Crawley
>> President, Liberal Party of Newfoundland & Labrador John Allan
>> President, Liberal Party of Prince Edward Island Ewan Clark
>> President, Nova Scotia Liberal Party John Gillis
>> President, New Brunswick Liberal Association Britt Dysart
>> President, Liberal Party of Canada (Québec) Linda Julien
>> President, Liberal Party of Canada (Ontario) Tyler Banham
>> President, Liberal Party of Canada (Manitoba) Sachit Mehra
>> President, Liberal Party of Canada (Saskatchewan) Evatt Merchant
>> President, Liberal Party of Canada (Alberta) Robbie Schuett
>> President, Liberal Party of Canada (British Columbia) Braeden
>> Caley
>> President, Federal Liberal Association of Yukon Blake Rogers
>> President, Liberal Party of Canada (Northwest Territories) Rosanna
>> Nicol
>> President, Federal Liberal Association of Nunavut Michel Potvin
>> Caucus Representative Francis Scarpaleggia
>> Co-Chair, Aboriginal Peoples’ Commission (Female) Caitlin Tolley
>> Co-Chair, Aboriginal Peoples’ Commission (Male) Kevin Seesequasis
>> President, National Women’s Liberal Commission Carlene Variyan
>> President, Young Liberals of Canada Justin Kaiser
>> Co-Chair, Senior Liberals’ Commission (French) Anne Adams
>> Co-Chair, Senior Liberals’ Commission (English) Kenneth D. Halliday
>> Chair, Council of Presidents Veena Bhullar
>> Chief Financial Officer Chuck Rifici
>> Chief Revenue Officer Stephen Bronfman
>> CEO, Federal Liberal Agency of Canada Mike Eizenga
>> National Campaign Co-Chair Katie Telford
>> Constitutional and Legal Adviser (English) Craig Munroe
>> Constitutional and Legal Adviser (French) Elise Bartlett
>>
>> Craig T. Munroe, Partner
>> Email: cmunroe@glgmlaw.com
>> Phone: (604) 891-1176
>>
>>
selle@gnb.ca>, Erin.Hardy@snb.ca,
>>> David.Eidt@gnb.ca
>>> Cc: David Amos <david.raymond.amos@gmail.com>
>>>
>>>
>>>> ---------- Forwarded message ----------
>>>> From: David Amos motomaniac333@gmail.com
>>>> Date: Mon, 12 Jun 2017 09:32:09 -0400
>>>> Subject: Attn Integrity Commissioner Alexandre Deschênes, Q.C.,
>>>> To: coi@gnb.ca
>>>> Cc: david.raymond.amos@gmail.com
>>>>
>>>> Good Day Sir
>>>>
>>>> After I heard you speak on CBC I called your office again and managed
>>>> to speak to one of your staff for the first time
>>>>
>>>> Please find attached the documents I promised to send to the lady who
>>>> answered the phone this morning. Please notice that not after the Sgt
>>>> at Arms took the documents destined to your office his pal Tanker
>>>> Malley barred me in writing with an "English" only document.
>>>>
>>>> These are the hearings and the dockets in Federal Court that I
>>>> suggested that you study closely.
>>>>
>>>> This is the docket in Federal Court
>>>>
>>>> http://cas-cdc-www02.cas-satj.
>>>>
>>>> These are digital recordings of the last three hearings
>>>>
>>>> Dec 14th https://archive.org/details/
>>>>
>>>> January 11th, 2016 https://archive.org/details/
>>>>
>>>> April 3rd, 2017
>>>>
>>>> https://archive.org/details/
>>>>
>>>>
>>>> This is the docket in the Federal Court of Appeal
>>>>
>>>> http://cas-cdc-www02.cas-satj.
>>>>
>>>>
>>>> The only hearing thus far
>>>>
>>>> May 24th, 2017
>>>>
>>>> https://archive.org/details/
>>>>
>>>>
>>>> This Judge understnds the meaning of the word Integrity
>>>>
>>>> Date: 20151223
>>>>
>>>> Docket: T-1557-15
>>>>
>>>> Fredericton, New Brunswick, December 23, 2015
>>>>
>>>> PRESENT: The Honourable Mr. Justice Bell
>>>>
>>>> BETWEEN:
>>>>
>>>> DAVID RAYMOND AMOS
>>>>
>>>> Plaintiff
>>>>
>>>> and
>>>>
>>>> HER MAJESTY THE QUEEN
>>>>
>>>> Defendant
>>>>
>>>> ORDER
>>>>
>>>> (Delivered orally from the Bench in Fredericton, New Brunswick, on
>>>> December 14, 2015)
>>>>
>>>> The Plaintiff seeks an appeal de novo, by way of motion pursuant to
>>>> the Federal Courts Rules (SOR/98-106), from an Order made on November
>>>> 12, 2015, in which Prothonotary Morneau struck the Statement of Claim
>>>> in its entirety.
>>>>
>>>> At the outset of the hearing, the Plaintiff brought to my attention a
>>>> letter dated September 10, 2004, which he sent to me, in my then
>>>> capacity as Past President of the New Brunswick Branch of the Canadian
>>>> Bar Association, and the then President of the Branch, Kathleen Quigg,
>>>> (now a Justice of the New Brunswick Court of Appeal). In that letter
>>>> he stated:
>>>>
>>>> As for your past President, Mr. Bell, may I suggest that you check the
>>>> work of Frank McKenna before I sue your entire law firm including you.
>>>> You are your brother’s keeper.
>>>>
>>>> Frank McKenna is the former Premier of New Brunswick and a former
>>>> colleague of mine at the law firm of McInnes Cooper. In addition to
>>>> expressing an intention to sue me, the Plaintiff refers to a number of
>>>> people in his Motion Record who he appears to contend may be witnesses
>>>> or potential parties to be added. Those individuals who are known to
>>>> me personally, include, but are not limited to the former Prime
>>>> Minister of Canada, The Right Honourable Stephen Harper; former
>>>> Attorney General of Canada and now a Justice of the Manitoba Court of
>>>> Queen’s Bench, Vic Toews; former member of Parliament Rob Moore;
>>>> former Director of Policing Services, the late Grant Garneau; former
>>>> Chief of the Fredericton Police Force, Barry McKnight; former Staff
>>>> Sergeant Danny Copp; my former colleagues on the New Brunswick Court
>>>> of Appeal, Justices Bradley V. Green and Kathleen Quigg, and, retired
>>>> Assistant Commissioner Wayne Lang of the Royal Canadian Mounted
>>>> Police.
>>>>
>>>> In the circumstances, given the threat in 2004 to sue me in my
>>>> personal capacity and my past and present relationship with many
>>>> potential witnesses and/or potential parties to the litigation, I am
>>>> of the view there would be a reasonable apprehension of bias should I
>>>> hear this motion. See Justice de Grandpré’s dissenting judgment in
>>>> Committee for Justice and Liberty et al v National Energy Board et al,
>>>> [1978] 1 SCR 369 at p 394 for the applicable test regarding
>>>> allegations of bias. In the circumstances, although neither party has
>>>> requested I recuse myself, I consider it appropriate that I do so.
>>>>
>>>>
>>>> AS A RESULT OF MY RECUSAL, THIS COURT ORDERS that the Administrator of
>>>> the Court schedule another date for the hearing of the motion. There
>>>> is no order as to costs.
>>>>
>>>> “B. Richard Bell”
>>>> Judge
>>>>
>>>>
>>>> Below after the CBC article about your concerns (I made one comment
>>>> already) you will find the text of just two of many emails I had sent
>>>> to your office over the years since I first visited it in 2006.
>>>>
>>>> I noticed that on July 30, 2009, he was appointed to the the Court
>>>> Martial Appeal Court of Canada Perhaps you should scroll to the
>>>> bottom of this email ASAP and read the entire Paragraph 83 of my
>>>> lawsuit now before the Federal Court of Canada?
>>>>
>>>> "FYI This is the text of the lawsuit that should interest Trudeau the
>>>> most
>>>>
>>>>
>>>> ---------- Original message ----------
>>>> From: justin.trudeau.a1@parl.gc.ca
>>>> Date: Thu, Oct 22, 2015 at 8:18 PM
>>>> Subject: Réponse automatique : RE My complaint against the CROWN in
>>>> Federal Court Attn David Hansen and Peter MacKay If you planning to
>>>> submit a motion for a publication ban on my complaint trust that you
>>>> dudes are way past too late
>>>> To: david.raymond.amos@gmail.com
>>>>
>>>> Veuillez noter que j'ai changé de courriel. Vous pouvez me rejoindre à
>>>> lalanthier@hotmail.com
>>>>
>>>> Pour rejoindre le bureau de M. Trudeau veuillez envoyer un courriel à
>>>> tommy.desfosses@parl.gc.ca
>>>>
>>>> Please note that I changed email address, you can reach me at
>>>> lalanthier@hotmail.com
>>>>
>>>> To reach the office of Mr. Trudeau please send an email to
>>>> tommy.desfosses@parl.gc.ca
>>>>
>>>> Thank you,
>>>>
>>>> Merci ,
>>>>
>>>>
>>>> http://davidraymondamos3.
>>>>
>>>>
>>>> 83. The Plaintiff states that now that Canada is involved in more war
>>>> in Iraq again it did not serve Canadian interests and reputation to
>>>> allow Barry Winters to publish the following words three times over
>>>> five years after he began his bragging:
>>>>
>>>> January 13, 2015
>>>> This Is Just AS Relevant Now As When I wrote It During The Debate
>>>>
>>>> December 8, 2014
>>>> Why Canada Stood Tall!
>>>>
>>>> Friday, October 3, 2014
>>>> Little David Amos’ “True History Of War” Canadian Airstrikes And
>>>> Stupid Justin Trudeau
>>>>
>>>> Canada’s and Canadians free ride is over. Canada can no longer hide
>>>> behind Amerka’s and NATO’s skirts.
>>>>
>>>> When I was still in Canadian Forces then Prime Minister Jean Chretien
>>>> actually committed the Canadian Army to deploy in the second campaign
>>>> in Iraq, the Coalition of the Willing. This was against or contrary to
>>>> the wisdom or advice of those of us Canadian officers that were
>>>> involved in the initial planning phases of that operation. There were
>>>> significant concern in our planning cell, and NDHQ about of the dearth
>>>> of concern for operational guidance, direction, and forces for
>>>> operations after the initial occupation of Iraq. At the “last minute”
>>>> Prime Minister Chretien and the Liberal government changed its mind.
>>>> The Canadian government told our amerkan cousins that we would not
>>>> deploy combat troops for the Iraq campaign, but would deploy a
>>>> Canadian Battle Group to Afghanistan, enabling our amerkan cousins to
>>>> redeploy troops from there to Iraq. The PMO’s thinking that it was
>>>> less costly to deploy Canadian Forces to Afghanistan than Iraq. But
>>>> alas no one seems to remind the Liberals of Prime Minister Chretien’s
>>>> then grossly incorrect assumption. Notwithstanding Jean Chretien’s
>>>> incompetence and stupidity, the Canadian Army was heroic,
>>>> professional, punched well above it’s weight, and the PPCLI Battle
>>>> Group, is credited with “saving Afghanistan” during the Panjway
>>>> campaign of 2006.
>>>>
>>>> What Justin Trudeau and the Liberals don’t tell you now, is that then
>>>> Liberal Prime Minister Jean Chretien committed, and deployed the
>>>> Canadian army to Canada’s longest “war” without the advice, consent,
>>>> support, or vote of the Canadian Parliament.
>>>>
>>>> What David Amos and the rest of the ignorant, uneducated, and babbling
>>>> chattering classes are too addled to understand is the deployment of
>>>> less than 75 special operations troops, and what is known by planners
>>>> as a “six pac cell” of fighter aircraft is NOT the same as a
>>>> deployment of a Battle Group, nor a “war” make.
>>>>
>>>> The Canadian Government or The Crown unlike our amerkan cousins have
>>>> the “constitutional authority” to commit the Canadian nation to war.
>>>> That has been recently clearly articulated to the Canadian public by
>>>> constitutional scholar Phillippe Legasse. What Parliament can do is
>>>> remove “confidence” in The Crown’s Government in a “vote of
>>>> non-confidence.” That could not happen to the Chretien Government
>>>> regarding deployment to Afghanistan, and it won’t happen in this
>>>> instance with the conservative majority in The Commons regarding a
>>>> limited Canadian deployment to the Middle East.
>>>>
>>>> President George Bush was quite correct after 911 and the terror
>>>> attacks in New York; that the Taliban “occupied” and “failed state”
>>>> Afghanistan was the source of logistical support, command and control,
>>>> and training for the Al Quaeda war of terror against the world. The
>>>> initial defeat, and removal from control of Afghanistan was vital and
>>>>
>>>> P.S. Whereas this CBC article is about your opinion of the actions of
>>>> the latest Minister Of Health trust that Mr Boudreau and the CBC have
>>>> had my files for many years and the last thing they are is ethical.
>>>> Ask his friends Mr Murphy and the RCMP if you don't believe me.
>>>>
>>>> Subject:
>>>> Date: Tue, 30 Jan 2007 12:02:35 -0400
>>>> From: "Murphy, Michael B. \(DH/MS\)" MichaelB.Murphy@gnb.ca
>>>> To: motomaniac_02186@yahoo.com
>>>>
>>>> January 30, 2007
>>>>
>>>> WITHOUT PREJUDICE
>>>>
>>>> Mr. David Amos
>>>>
>>>> Dear Mr. Amos:
>>>>
>>>> This will acknowledge receipt of a copy of your e-mail of December 29,
>>>> 2006 to Corporal Warren McBeath of the RCMP.
>>>>
>>>> Because of the nature of the allegations made in your message, I have
>>>> taken the measure of forwarding a copy to Assistant Commissioner Steve
>>>> Graham of the RCMP “J” Division in Fredericton.
>>>>
>>>> Sincerely,
>>>>
>>>> Honourable Michael B. Murphy
>>>> Minister of Health
>>>>
>>>> CM/cb
>>>>
>>>>
>>>> Warren McBeath warren.mcbeath@rcmp-grc.gc.ca wrote:
>>>>
>>>> Date: Fri, 29 Dec 2006 17:34:53 -0500
>>>> From: "Warren McBeath" warren.mcbeath@rcmp-grc.gc.ca
>>>> To: kilgoursite@ca.inter.net, MichaelB.Murphy@gnb.ca,
>>>> nada.sarkis@gnb.ca, wally.stiles@gnb.ca, dwatch@web.net,
>>>> motomaniac_02186@yahoo.com
>>>> CC: ottawa@chuckstrahl.com, riding@chuckstrahl.com,John.
>>>> Oda.B@parl.gc.ca,"Bev BUSSON" bev.busson@rcmp-grc.gc.ca,
>>>> "Paul Dube" PAUL.DUBE@rcmp-grc.gc.ca
>>>> Subject: Re: Remember me Kilgour? Landslide Annie McLellan has
>>>> forgotten me but the crooks within the RCMP have not
>>>>
>>>> Dear Mr. Amos,
>>>>
>>>> Thank you for your follow up e-mail to me today. I was on days off
>>>> over the holidays and returned to work this evening. Rest assured I
>>>> was not ignoring or procrastinating to respond to your concerns.
>>>>
>>>> As your attachment sent today refers from Premier Graham, our position
>>>> is clear on your dead calf issue: Our forensic labs do not process
>>>> testing on animals in cases such as yours, they are referred to the
>>>> Atlantic Veterinary College in Charlottetown who can provide these
>>>> services. If you do not choose to utilize their expertise in this
>>>> instance, then that is your decision and nothing more can be done.
>>>>
>>>> As for your other concerns regarding the US Government, false
>>>> imprisonment and Federal Court Dates in the US, etc... it is clear
>>>> that Federal authorities are aware of your concerns both in Canada
>>>> the US. These issues do not fall into the purvue of Detachment
>>>> and policing in Petitcodiac, NB.
>>>>
>>>> It was indeed an interesting and informative conversation we had on
>>>> December 23rd, and I wish you well in all of your future endeavors.
>>>>
>>>> Sincerely,
>>>>
>>>> Warren McBeath, Cpl.
>>>> GRC Caledonia RCMP
>>>> Traffic Services NCO
>>>> Ph: (506) 387-2222
>>>> Fax: (506) 387-4622
>>>> E-mail warren.mcbeath@rcmp-grc.gc.ca
>>>>
>>>>
>>>>
>>>> Alexandre Deschênes, Q.C.,
>>>> Office of the Integrity Commissioner
>>>> Edgecombe House, 736 King Street
>>>> Fredericton, N.B. CANADA E3B 5H1
>>>> tel.: 506-457-7890
>>>> fax: 506-444-5224
>>>> e-mail:coi@gnb.ca
>>>>
>>>
>>> ---------- Forwarded message ----------
>>>
>>> http://davidraymondamos3.
>>>
>>>
>>> Sunday, 19 November 2017
>>> Federal Court of Appeal Finally Makes The BIG Decision And Publishes
>>> It Now The Crooks Cannot Take Back Ticket To Try Put My Matter Before
>>> The Supreme Court
>>>
>>> https://decisions.fct-cf.gc.
>>>
>>>
>>> Federal Court of Appeal Decisions
>>>
>>> Amos v. Canada
>>> Court (s) Database
>>>
>>> Federal Court of Appeal Decisions
>>> Date
>>>
>>> 2017-10-30
>>> Neutral citation
>>>
>>> 2017 FCA 213
>>> File numbers
>>>
>>> A-48-16
>>> Date: 20171030
>>>
>>> Docket: A-48-16
>>> Citation: 2017 FCA 213
>>> CORAM:
>>>
>>> WEBB J.A.
>>> NEAR J.A.
>>> GLEASON J.A.
>>>
>>>
>>> BETWEEN:
>>> DAVID RAYMOND AMOS
>>> Respondent on the cross-appeal
>>> (and formally Appellant)
>>> and
>>> HER MAJESTY THE QUEEN
>>> Appellant on the cross-appeal
>>> (and formerly Respondent)
>>> Heard at Fredericton, New Brunswick, on May 24, 2017.
>>> Judgment delivered at Ottawa, Ontario, on October 30, 2017.
>>> REASONS FOR JUDGMENT BY:
>>>
>>> THE COURT
>>>
>>>
>>>
>>> Date: 20171030
>>>
>>> Docket: A-48-16
>>> Citation: 2017 FCA 213
>>> CORAM:
>>>
>>> WEBB J.A.
>>> NEAR J.A.
>>> GLEASON J.A.
>>>
>>>
>>> BETWEEN:
>>> DAVID RAYMOND AMOS
>>> Respondent on the cross-appeal
>>> (and formally Appellant)
>>> and
>>> HER MAJESTY THE QUEEN
>>> Appellant on the cross-appeal
>>> (and formerly Respondent)
>>> REASONS FOR JUDGMENT BY THE COURT
>>>
>>> I. Introduction
>>>
>>> [1] On September 16, 2015, David Raymond Amos (Mr. Amos)
>>> filed a 53-page Statement of Claim (the Claim) in Federal Court
>>> against Her Majesty the Queen (the Crown). Mr. Amos claims $11 million
>>> in damages and a public apology from the Prime Minister and Provincial
>>> Premiers for being illegally barred from accessing parliamentary
>>> properties and seeks a declaration from the Minister of Public Safety
>>> that the Canadian Government will no longer allow the Royal Canadian
>>> Mounted Police (RCMP) and Canadian Forces to harass him and his clan
>>> (Claim at para. 96).
>>>
>>> [2] On November 12, 2015 (Docket T-1557-15), by way of a
>>> motion brought by the Crown, a prothonotary of the Federal Court (the
>>> Prothonotary) struck the Claim in its entirety, without leave to
>>> amend, on the basis that it was plain and obvious that the Claim
>>> disclosed no reasonable claim, the Claim was fundamentally vexatious,
>>> and the Claim could not be salvaged by way of further amendment (the
>>> Prothontary’s Order).
>>>
>>>
>>> [3] On January 25, 2016 (2016 FC 93), by way of Mr.
>>> Amos’ appeal from the Prothonotary’s Order, a judge of the Federal
>>> Court (the Judge), reviewing the matter de novo, struck all of Mr.
>>> Amos’ claims for relief with the exception of the claim for damages
>>> for being barred by the RCMP from the New Brunswick legislature in
>>> 2004 (the Federal Court Judgment).
>>>
>>>
>>> [4] Mr. Amos appealed and the Crown cross-appealed the
>>> Federal Court Judgment. Further to the issuance of a Notice of Status
>>> Review, Mr. Amos’ appeal was dismissed for delay on December 19, 2016.
>>> As such, the only matter before this Court is the Crown’s
>>> cross-appeal.
>>>
>>>
>>> II. Preliminary Matter
>>>
>>> [5] Mr. Amos, in his memorandum of fact and law in
>>> relation to the cross-appeal that was filed with this Court on March
>>> 6, 2017, indicated that several judges of this Court, including two of
>>> the judges of this panel, had a conflict of interest in this appeal.
>>> This was the first time that he identified the judges whom he believed
>>> had a conflict of interest in a document that was filed with this
>>> Court. In his notice of appeal he had alluded to a conflict with
>>> several judges but did not name those judges.
>>>
>>> [6] Mr. Amos was of the view that he did not have to
>>> identify the judges in any document filed with this Court because he
>>> had identified the judges in various documents that had been filed
>>> with the Federal Court. In his view the Federal Court and the Federal
>>> Court of Appeal are the same court and therefore any document filed in
>>> the Federal Court would be filed in this Court. This view is based on
>>> subsections 5(4) and 5.1(4) of the Federal Courts Act, R.S.C., 1985,
>>> c. F-7:
>>>
>>>
>>> 5(4) Every judge of the Federal Court is, by virtue of his or her
>>> office, a judge of the Federal Court of Appeal and has all the
>>> jurisdiction, power and authority of a judge of the Federal Court of
>>> Appeal.
>>> […]
>>>
>>> 5(4) Les juges de la Cour fédérale sont d’office juges de la Cour
>>> d’appel fédérale et ont la même compétence et les mêmes pouvoirs que
>>> les juges de la Cour d’appel fédérale.
>>> […]
>>> 5.1(4) Every judge of the Federal Court of Appeal is, by virtue of
>>> that office, a judge of the Federal Court and has all the
>>> jurisdiction, power and authority of a judge of the Federal Court.
>>>
>>> 5.1(4) Les juges de la Cour d’appel fédérale sont d’office juges de la
>>> Cour fédérale et ont la même compétence et les mêmes pouvoirs que les
>>> juges de la Cour fédérale.
>>>
>>>
>>> [7] However, these subsections only provide that the
>>> judges of the Federal Court are also judges of this Court (and vice
>>> versa). It does not mean that there is only one court. If the Federal
>>> Court and this Court were one Court, there would be no need for this
>>> section.
>>> [8] Sections 3 and 4 of the Federal Courts Act provide
>>> that:
>>> 3 The division of the Federal Court of Canada called the Federal Court
>>> — Appeal Division is continued under the name “Federal Court of
>>> Appeal” in English and “Cour d’appel fédérale” in French. It is
>>> continued as an additional court of law, equity and admiralty in and
>>> for Canada, for the better administration of the laws of Canada and as
>>> a superior court of record having civil and criminal jurisdiction.
>>>
>>> 3 La Section d’appel, aussi appelée la Cour d’appel ou la Cour d’appel
>>> fédérale, est maintenue et dénommée « Cour d’appel fédérale » en
>>> français et « Federal Court of Appeal » en anglais. Elle est maintenue
>>> à titre de tribunal additionnel de droit, d’equity et d’amirauté du
>>> Canada, propre à améliorer l’application du droit canadien, et
>>> continue d’être une cour supérieure d’archives ayant compétence en
>>> matière civile et pénale.
>>> 4 The division of the Federal Court of Canada called the Federal Court
>>> — Trial Division is continued under the name “Federal Court” in
>>> English and “Cour fédérale” in French. It is continued as an
>>> additional court of law, equity and admiralty in and for Canada, for
>>> the better administration of the laws of Canada and as a superior
>>> court of record having civil and criminal jurisdiction.
>>>
>>> 4 La section de la Cour fédérale du Canada, appelée la Section de
>>> première instance de la Cour fédérale, est maintenue et dénommée «
>>> Cour fédérale » en français et « Federal Court » en anglais. Elle est
>>> maintenue à titre de tribunal additionnel de droit, d’equity et
>>> d’amirauté du Canada, propre à améliorer l’application du droit
>>> canadien, et continue d’être une cour supérieure d’archives ayant
>>> compétence en matière civile et pénale.
>>>
>>>
>>> [9] Sections 3 and 4 of the Federal Courts Act create
>>> two separate courts – this Court (section 3) and the Federal Court
>>> (section 4). If, as Mr. Amos suggests, documents filed in the Federal
>>> Court were automatically also filed in this Court, then there would no
>>> need for the parties to prepare and file appeal books as required by
>>> Rules 343 to 345 of the Federal Courts Rules, SOR/98-106 in relation
>>> to any appeal from a decision of the Federal Court. The requirement to
>>> file an appeal book with this Court in relation to an appeal from a
>>> decision of the Federal Court makes it clear that the only documents
>>> that will be before this Court are the documents that are part of that
>>> appeal book.
>>>
>>>
>>> [10] Therefore, the memorandum of fact and law filed on
>>> March 6, 2017 is the first document, filed with this Court, in which
>>> Mr. Amos identified the particular judges that he submits have a
>>> conflict in any matter related to him.
>>>
>>>
>>> [11] On April 3, 2017, Mr. Amos attempted to bring a motion
>>> before the Federal Court seeking an order “affirming or denying the
>>> conflict of interest he has” with a number of judges of the Federal
>>> Court. A judge of the Federal Court issued a direction noting that if
>>> Mr. Amos was seeking this order in relation to judges of the Federal
>>> Court of Appeal, it was beyond the jurisdiction of the Federal Court.
>>> Mr. Amos raised the Federal Court motion at the hearing of this
>>> cross-appeal. The Federal Court motion is not a motion before this
>>> Court and, as such, the submissions filed before the Federal Court
>>> will not be entertained. As well, since this was a motion brought
>>> before the Federal Court (and not this Court), any documents filed in
>>> relation to that motion are not part of the record of this Court.
>>>
>>>
>>> [12] During the hearing of the appeal Mr. Amos alleged that
>>> the third member of this panel also had a conflict of interest and
>>> submitted some documents that, in his view, supported his claim of a
>>> conflict. Mr. Amos, following the hearing of his appeal, was also
>>> afforded the opportunity to provide a brief summary of the conflict
>>> that he was alleging and to file additional documents that, in his
>>> view, supported his allegations. Mr. Amos submitted several pages of
>>> documents in relation to the alleged conflicts. He organized the
>>> documents by submitting a copy of the biography of the particular
>>> judge and then, immediately following that biography, by including
>>> copies of the documents that, in his view, supported his claim that
>>> such judge had a conflict.
>>>
>>>
>>> [13] The nature of the alleged conflict of Justice Webb is
>>> that before he was appointed as a Judge of the Tax Court of Canada in
>>> 2006, he was a partner with the law firm Patterson Law, and before
>>> that with Patterson Palmer in Nova Scotia. Mr. Amos submitted that he
>>> had a number of disputes with Patterson Palmer and Patterson Law and
>>> therefore Justice Webb has a conflict simply because he was a partner
>>> of these firms. Mr. Amos is not alleging that Justice Webb was
>>> personally involved in or had any knowledge of any matter in which Mr.
>>> Amos was involved with Justice Webb’s former law firm – only that he
>>> was a member of such firm.
>>>
>>>
>>> [14] During his oral submissions at the hearing of his
>>> appeal Mr. Amos, in relation to the alleged conflict for Justice Webb,
>>> focused on dealings between himself and a particular lawyer at
>>> Patterson Law. However, none of the documents submitted by Mr. Amos at
>>> the hearing or subsequently related to any dealings with this
>>> particular lawyer nor is it clear when Mr. Amos was dealing with this
>>> lawyer. In particular, it is far from clear whether such dealings were
>>> after the time that Justice Webb was appointed as a Judge of the Tax
>>> Court of Canada over 10 years ago.
>>>
>>>
>>> [15] The documents that he submitted in relation to the
>>> alleged conflict for Justice Webb largely relate to dealings between
>>> Byron Prior and the St. John’s Newfoundland and Labrador office of
>>> Patterson Palmer, which is not in the same province where Justice Webb
>>> practiced law. The only document that indicates any dealing between
>>> Mr. Amos and Patterson Palmer is a copy of an affidavit of Stephen May
>>> who was a partner in the St. John’s NL office of Patterson Palmer. The
>>> affidavit is dated January 24, 2005 and refers to a number of e-mails
>>> that were sent by Mr. Amos to Stephen May. Mr. Amos also included a
>>> letter that is addressed to four individuals, one of whom is John
>>> Crosbie who was counsel to the St. John’s NL office of Patterson
>>> Palmer. The letter is dated September 2, 2004 and is addressed to
>>> “John Crosbie, c/o Greg G. Byrne, Suite 502, 570 Queen Street,
>>> Fredericton, NB E3B 5E3”. In this letter Mr. Amos alludes to a
>>> possible lawsuit against Patterson Palmer.
>>> [16] Mr. Amos’ position is that simply because Justice Webb
>>> was a lawyer with Patterson Palmer, he now has a conflict. In Wewaykum
>>> Indian Band v. Her Majesty the Queen, 2003 SCC 45, [2003] 2 S.C.R.
>>> 259, the Supreme Court of Canada noted that disqualification of a
>>> judge is to be determined based on whether there is a reasonable
>>> apprehension of bias:
>>> 60 In Canadian law, one standard has now emerged as the
>>> criterion for disqualification. The criterion, as expressed by de
>>> Grandpré J. in Committee for Justice and Liberty v. National Energy
>>> Board, …[[1978] 1 S.C.R. 369, 68 D.L.R. (3d) 716], at p. 394, is the
>>> reasonable apprehension of bias:
>>> … the apprehension of bias must be a reasonable one, held by
>>> reasonable and right minded persons, applying themselves to the
>>> question and obtaining thereon the required information. In the words
>>> of the Court of Appeal, that test is "what would an informed person,
>>> viewing the matter realistically and practically -- and having thought
>>> the matter through -- conclude. Would he think that it is more likely
>>> than not that [the decision-maker], whether consciously or
>>> unconsciously, would not decide fairly."
>>>
>>> [17] The issue to be determined is whether an informed
>>> person, viewing the matter realistically and practically, and having
>>> thought the matter through, would conclude that Mr. Amos’ allegations
>>> give rise to a reasonable apprehension of bias. As this Court has
>>> previously remarked, “there is a strong presumption that judges will
>>> administer justice impartially” and this presumption will not be
>>> rebutted in the absence of “convincing evidence” of bias (Collins v.
>>> Canada, 2011 FCA 140 at para. 7, [2011] 4 C.T.C. 157 [Collins]. See
>>> also R. v. S. (R.D.), [1997] 3 S.C.R. 484 at para. 32, 151 D.L.R.
>>> (4th) 193).
>>>
>>> [18] The Ontario Court of Appeal in Rando Drugs Ltd. v.
>>> Scott, 2007 ONCA 553, 86 O.R. (3d) 653 (leave to appeal to the Supreme
>>> Court of Canada refused, 32285 (August 1, 2007)), addressed the
>>> particular issue of whether a judge is disqualified from hearing a
>>> case simply because he had been a member of a law firm that was
>>> involved in the litigation that was now before that judge. The Ontario
>>> Court of Appeal determined that the judge was not disqualified if the
>>> judge had no involvement with the person or the matter when he was a
>>> lawyer. The Ontario Court of Appeal also explained that the rules for
>>> determining whether a judge is disqualified are different from the
>>> rules to determine whether a lawyer has a conflict:
>>> 27 Thus, disqualification is not the natural corollary to a
>>> finding that a trial judge has had some involvement in a case over
>>> which he or she is now presiding. Where the judge had no involvement,
>>> as here, it cannot be said that the judge is disqualified.
>>>
>>>
>>> 28 The point can rightly be made that had Mr. Patterson been
>>> asked to represent the appellant as counsel before his appointment to
>>> the bench, the conflict rules would likely have prevented him from
>>> taking the case because his firm had formerly represented one of the
>>> defendants in the case. Thus, it is argued how is it that as a trial
>>> judge Patterson J. can hear the case? This issue was considered by the
>>> Court of Appeal (Civil Division) in Locabail (U.K.) Ltd. v. Bayfield
>>> Properties Ltd., [2000] Q.B. 451. The court held, at para. 58, that
>>> there is no inflexible rule governing the disqualification of a judge
>>> and that, "[e]verything depends on the circumstances."
>>>
>>>
>>> 29 It seems to me that what appears at first sight to be an
>>> inconsistency in application of rules can be explained by the
>>> different contexts and in particular, the strong presumption of
>>> judicial impartiality that applies in the context of disqualification
>>> of a judge. There is no such presumption in cases of allegations of
>>> conflict of interest against a lawyer because of a firm's previous
>>> involvement in the case. To the contrary, as explained by Sopinka J.
>>> in MacDonald Estate v. Martin (1990), 77 D.L.R. (4th) 249 (S.C.C.),
>>> for sound policy reasons there is a presumption of a disqualifying
>>> interest that can rarely be overcome. In particular, a conclusory
>>> statement from the lawyer that he or she had no confidential
>>> information about the case will never be sufficient. The case is the
>>> opposite where the allegation of bias is made against a trial judge.
>>> His or her statement that he or she knew nothing about the case and
>>> had no involvement in it will ordinarily be accepted at face value
>>> unless there is good reason to doubt it: see Locabail, at para. 19.
>>>
>>>
>>> 30 That brings me then to consider the particular circumstances
>>> of this case and whether there are serious grounds to find a
>>> disqualifying conflict of interest in this case. In my view, there are
>>> two significant factors that justify the trial judge's decision not to
>>> recuse himself. The first is his statement, which all parties accept,
>>> that he knew nothing of the case when it was in his former firm and
>>> that he had nothing to do with it. The second is the long passage of
>>> time. As was said in Wewaykum, at para. 85:
>>> To us, one significant factor stands out, and must inform
>>> the perspective of the reasonable person assessing the impact of this
>>> involvement on Binnie J.'s impartiality in the appeals. That factor is
>>> the passage of time. Most arguments for disqualification rest on
>>> circumstances that are either contemporaneous to the decision-making,
>>> or that occurred within a short time prior to the decision-making.
>>> 31 There are other factors that inform the issue. The Wilson
>>> Walker firm no longer acted for any of the parties by the time of
>>> trial. More importantly, at the time of the motion, Patterson J. had
>>> been a judge for six years and thus had not had a relationship with
>>> his former firm for a considerable period of time.
>>>
>>>
>>> 32 In my view, a reasonable person, viewing the matter
>>> realistically would conclude that the trial judge could deal fairly
>>> and impartially with this case. I take this view principally because
>>> of the long passage of time and the trial judge's lack of involvement
>>> in or knowledge of the case when the Wilson Walker firm had carriage.
>>> In these circumstances it cannot be reasonably contended that the
>>> trial judge could not remain impartial in the case. The mere fact that
>>> his name appears on the letterhead of some correspondence from over a
>>> decade ago would not lead a reasonable person to believe that he would
>>> either consciously or unconsciously favour his former firm's former
>>> client. It is simply not realistic to think that a judge would throw
>>> off his mantle of impartiality, ignore his oath of office and favour a
>>> client - about whom he knew nothing - of a firm that he left six years
>>> earlier and that no longer acts for the client, in a case involving
>>> events from over a decade ago.
>>> (emphasis added)
>>>
>>> [19] Justice Webb had no involvement with any matter
>>> involving Mr. Amos while he was a member of Patterson Palmer or
>>> Patterson Law, nor does Mr. Amos suggest that he did. Mr. Amos made it
>>> clear during the hearing of this matter that the only reason for the
>>> alleged conflict for Justice Webb was that he was a member of
>>> Patterson Law and Patterson Palmer. This is simply not enough for
>>> Justice Webb to be disqualified. Any involvement of Mr. Amos with
>>> Patterson Law while Justice Webb was a member of that firm would have
>>> had to occur over 10 years ago and even longer for the time when he
>>> was a member of Patterson Palmer. In addition to the lack of any
>>> involvement on his part with any matter or dispute that Mr. Amos had
>>> with Patterson Law or Patterson Palmer (which in and of itself is
>>> sufficient to dispose of this matter), the length of time since
>>> Justice Webb was a member of Patterson Law or Patterson Palmer would
>>> also result in the same finding – that there is no conflict in Justice
>>> Webb hearing this appeal.
>>>
>>> [20] Similarly in R. v. Bagot, 2000 MBCA 30, 145 Man. R.
>>> (2d) 260, the Manitoba Court of Appeal found that there was no
>>> reasonable apprehension of bias when a judge, who had been a member of
>>> the law firm that had been retained by the accused, had no involvement
>>> with the accused while he was a lawyer with that firm.
>>>
>>> [21] In Del Zotto v. Minister of National Revenue, [2000] 4
>>> F.C. 321, 257 N.R. 96, this court did find that there would be a
>>> reasonable apprehension of bias where a judge, who while he was a
>>> lawyer, had recorded time on a matter involving the same person who
>>> was before that judge. However, this case can be distinguished as
>>> Justice Webb did not have any time recorded on any files involving Mr.
>>> Amos while he was a lawyer with Patterson Palmer or Patterson Law.
>>>
>>> [22] Mr. Amos also included with his submissions a CD. He
>>> stated in his affidavit dated June 26, 2017 that there is a “true copy
>>> of an American police surveillance wiretap entitled 139” on this CD.
>>> He has also indicated that he has “provided a true copy of the CD
>>> entitled 139 to many American and Canadian law enforcement authorities
>>> and not one of the police forces or officers of the court are willing
>>> to investigate it”. Since he has indicated that this is an “American
>>> police surveillance wiretap”, this is a matter for the American law
>>> enforcement authorities and cannot create, as Mr. Amos suggests, a
>>> conflict of interest for any judge to whom he provides a copy.
>>>
>>> [23] As a result, there is no conflict or reasonable
>>> apprehension of bias for Justice Webb and therefore, no reason for him
>>> to recuse himself.
>>>
>>> [24] Mr. Amos alleged that Justice Near’s past professional
>>> experience with the government created a “quasi-conflict” in deciding
>>> the cross-appeal. Mr. Amos provided no details and Justice Near
>>> confirmed that he had no prior knowledge of the matters alleged in the
>>> Claim. Justice Near sees no reason to recuse himself.
>>>
>>> [25] Insofar as it is possible to glean the basis for Mr.
>>> Amos’ allegations against Justice Gleason, it appears that he alleges
>>> that she is incapable of hearing this appeal because he says he wrote
>>> a letter to Brian Mulroney and Jean Chrétien in 2004. At that time,
>>> both Justice Gleason and Mr. Mulroney were partners in the law firm
>>> Ogilvy Renault, LLP. The letter in question, which is rude and angry,
>>> begins with “Hey you two Evil Old Smiling Bastards” and “Re: me suing
>>> you and your little dogs too”. There is no indication that the letter
>>> was ever responded to or that a law suit was ever commenced by Mr.
>>> Amos against Mr. Mulroney. In the circumstances, there is no reason
>>> for Justice Gleason to recuse herself as the letter in question does
>>> not give rise to a reasonable apprehension of bias.
>>>
>>>
>>> III. Issue
>>>
>>> [26] The issue on the cross-appeal is as follows: Did the
>>> Judge err in setting aside the Prothonotary’s Order striking the Claim
>>> in its entirety without leave to amend and in determining that Mr.
>>> Amos’ allegation that the RCMP barred him from the New Brunswick
>>> legislature in 2004 was capable of supporting a cause of action?
>>>
>>> IV. Analysis
>>>
>>> A. Standard of Review
>>>
>>> [27] Following the Judge’s decision to set aside the
>>> Prothonotary’s Order, this Court revisited the standard of review to
>>> be applied to discretionary decisions of prothonotaries and decisions
>>> made by judges on appeals of prothonotaries’ decisions in Hospira
>>> Healthcare Corp. v. Kennedy Institute of Rheumatology, 2016 FCA 215,
>>> 402 D.L.R. (4th) 497 [Hospira]. In Hospira, a five-member panel of
>>> this Court replaced the Aqua-Gem standard of review with that
>>> articulated in Housen v. Nikolaisen, 2002 SCC 33, [2002] 2 S.C.R. 235
>>> [Housen]. As a result, it is no longer appropriate for the Federal
>>> Court to conduct a de novo review of a discretionary order made by a
>>> prothonotary in regard to questions vital to the final issue of the
>>> case. Rather, a Federal Court judge can only intervene on appeal if
>>> the prothonotary made an error of law or a palpable and overriding
>>> error in determining a question of fact or question of mixed fact and
>>> law (Hospira at para. 79). Further, this Court can only interfere with
>>> a Federal Court judge’s review of a prothonotary’s discretionary order
>>> if the judge made an error of law or palpable and overriding error in
>>> determining a question of fact or question of mixed fact and law
>>> (Hospira at paras. 82-83).
>>>
>>> [28] In the case at bar, the Judge substituted his own
>>> assessment of Mr. Amos’ Claim for that of the Prothonotary. This Court
>>> must look to the Prothonotary’s Order to determine whether the Judge
>>> erred in law or made a palpable and overriding error in choosing to
>>> interfere.
>>>
>>>
>>> B. Did the Judge err in interfering with the
>>> Prothonotary’s Order?
>>>
>>> [29] The Prothontoary’s Order accepted the following
>>> paragraphs from the Crown’s submissions as the basis for striking the
>>> Claim in its entirety without leave to amend:
>>>
>>> 17. Within the 96 paragraph Statement of Claim, the Plaintiff
>>> addresses his complaint in paragraphs 14-24, inclusive. All but four
>>> of those paragraphs are dedicated to an incident that occurred in 2006
>>> in and around the legislature in New Brunswick. The jurisdiction of
>>> the Federal Court does not extend to Her Majesty the Queen in right of
>>> the Provinces. In any event, the Plaintiff hasn’t named the Province
>>> or provincial actors as parties to this action. The incident alleged
>>> does not give rise to a justiciable cause of action in this Court.
>>> (…)
>>>
>>>
>>> 21. The few paragraphs that directly address the Defendant
>>> provide no details as to the individuals involved or the location of
>>> the alleged incidents or other details sufficient to allow the
>>> Defendant to respond. As a result, it is difficult or impossible to
>>> determine the causes of action the Plaintiff is attempting to advance.
>>> A generous reading of the Statement of Claim allows the Defendant to
>>> only speculate as to the true and/or intended cause of action. At
>>> best, the Plaintiff’s action may possibly be summarized as: he
>>> suspects he is barred from the House of Commons.
>>> [footnotes omitted].
>>>
>>>
>>> [30] The Judge determined that he could not strike the Claim
>>> on the same jurisdictional basis as the Prothonotary. The Judge noted
>>> that the Federal Court has jurisdiction over claims based on the
>>> liability of Federal Crown servants like the RCMP and that the actors
>>> who barred Mr. Amos from the New Brunswick legislature in 2004
>>> included the RCMP (Federal Court Judgment at para. 23). In considering
>>> the viability of these allegations de novo, the Judge identified
>>> paragraph 14 of the Claim as containing “some precision” as it
>>> identifies the date of the event and a RCMP officer acting as
>>> Aide-de-Camp to the Lieutenant Governor (Federal Court Judgment at
>>> para. 27).
>>>
>>>
>>> [31] The Judge noted that the 2004 event could support a
>>> cause of action in the tort of misfeasance in public office and
>>> identified the elements of the tort as excerpted from Meigs v. Canada,
>>> 2013 FC 389, 431 F.T.R. 111:
>>>
>>>
>>> [13] As in both the cases of Odhavji Estate v Woodhouse, 2003 SCC
>>> 69 [Odhavji] and Lewis v Canada, 2012 FC 1514 [Lewis], I must
>>> determine whether the plaintiffs’ statement of claim pleads each
>>> element of the alleged tort of misfeasance in public office:
>>>
>>> a) The public officer must have engaged in deliberate and unlawful
>>> conduct in his or her capacity as public officer;
>>>
>>> b) The public officer must have been aware both that his or her
>>> conduct was unlawful and that it was likely to harm the plaintiff; and
>>>
>>> c) There must be an element of bad faith or dishonesty by the public
>>> officer and knowledge of harm alone is insufficient to conclude that a
>>> public officer acted in bad faith or dishonestly.
>>> Odhavji, above, at paras 23, 24 and 28
>>> (Federal Court Judgment at para. 28).
>>>
>>> [32] The Judge determined that Mr. Amos disclosed sufficient
>>> material facts to meet the elements of the tort of misfeasance in
>>> public office because the actors, who barred him from the New
>>> Brunswick legislature in 2004, including the RCMP, did so for
>>> “political reasons” (Federal Court Judgment at para. 29).
>>>
>>> [33] This Court’s discussion of the sufficiency of pleadings
>>> in Merchant Law Group v. Canada (Revenue Agency), 2010 FCA 184, 321
>>> D.L.R (4th) 301 is particularly apt:
>>>
>>> …When pleading bad faith or abuse of power, it is not enough to
>>> assert, baldly, conclusory phrases such as “deliberately or
>>> negligently,” “callous disregard,” or “by fraud and theft did steal”.
>>> “The bare assertion of a conclusion upon which the court is called
>>> upon to pronounce is not an allegation of material fact”. Making bald,
>>> conclusory allegations without any evidentiary foundation is an abuse
>>> of process…
>>>
>>> To this, I would add that the tort of misfeasance in public office
>>> requires a particular state of mind of a public officer in carrying
>>> out the impunged action, i.e., deliberate conduct which the public
>>> officer knows to be inconsistent with the obligations of his or her
>>> office. For this tort, particularization of the allegations is
>>> mandatory. Rule 181 specifically requires particularization of
>>> allegations of “breach of trust,” “wilful default,” “state of mind of
>>> a person,” “malice” or “fraudulent intention.”
>>> (at paras. 34-35, citations omitted).
>>>
>>> [34] Applying the Housen standard of review to the
>>> Prothonotary’s Order, we are of the view that the Judge interfered
>>> absent a legal or palpable and overriding error.
>>>
>>> [35] The Prothonotary determined that Mr. Amos’ Claim
>>> disclosed no reasonable claim and was fundamentally vexatious on the
>>> basis of jurisdictional concerns and the absence of material facts to
>>> ground a cause of action. Paragraph 14 of the Claim, which addresses
>>> the 2004 event, pleads no material facts as to how the RCMP officer
>>> engaged in deliberate and unlawful conduct, knew that his or her
>>> conduct was unlawful and likely to harm Mr. Amos, and acted in bad
>>> faith. While the Claim alleges elsewhere that Mr. Amos was barred from
>>> the New Brunswick legislature for political and/or malicious reasons,
>>> these allegations are not particularized and are directed against
>>> non-federal actors, such as the Sergeant-at-Arms of the Legislative
>>> Assembly of New Brunswick and the Fredericton Police Force. As such,
>>> the Judge erred in determining that Mr. Amos’ allegation that the RCMP
>>> barred him from the New Brunswick legislature in 2004 was capable of
>>> supporting a cause of action.
>>>
>>> [36] In our view, the Claim is made up entirely of bare
>>> allegations, devoid of any detail, such that it discloses no
>>> reasonable cause of action within the jurisdiction of the Federal
>>> Courts. Therefore, the Judge erred in interfering to set aside the
>>> Prothonotary’s Order striking the claim in its entirety. Further, we
>>> find that the Prothonotary made no error in denying leave to amend.
>>> The deficiencies in Mr. Amos’ pleadings are so extensive such that
>>> amendment could not cure them (see Collins at para. 26).
>>>
>>> V. Conclusion
>>> [37] For the foregoing reasons, we would allow the Crown’s
>>> cross-appeal, with costs, setting aside the Federal Court Judgment,
>>> dated January 25, 2016 and restoring the Prothonotary’s Order, dated
>>> November 12, 2015, which struck Mr. Amos’ Claim in its entirety
>>> without leave to amend.
>>> "Wyman W. Webb"
>>> J.A.
>>> "David G. Near"
>>> J.A.
>>> "Mary J.L. Gleason"
>>> J.A.
>>>
>>>
>>>
>>> FEDERAL COURT OF APPEAL
>>> NAMES OF COUNSEL AND SOLICITORS OF RECORD
>>>
>>> A CROSS-APPEAL FROM AN ORDER OF THE HONOURABLE JUSTICE SOUTHCOTT DATED
>>> JANUARY 25, 2016; DOCKET NUMBER T-1557-15.
>>> DOCKET:
>>>
>>> A-48-16
>>>
>>>
>>>
>>> STYLE OF CAUSE:
>>>
>>> DAVID RAYMOND AMOS v. HER MAJESTY THE QUEEN
>>>
>>>
>>>
>>> PLACE OF HEARING:
>>>
>>> Fredericton,
>>> New Brunswick
>>>
>>> DATE OF HEARING:
>>>
>>> May 24, 2017
>>>
>>> REASONS FOR JUDGMENT OF THE COURT BY:
>>>
>>> WEBB J.A.
>>> NEAR J.A.
>>> GLEASON J.A.
>>>
>>> DATED:
>>>
>>> October 30, 2017
>>>
>>> APPEARANCES:
>>> David Raymond Amos
>>>
>>>
>>> For The Appellant / respondent on cross-appeal
>>> (on his own behalf)
>>>
>>> Jan Jensen
>>>
>>>
>>> For The Respondent / appELLANT ON CROSS-APPEAL
>>>
>>> SOLICITORS OF RECORD:
>>> Nathalie G. Drouin
>>> Deputy Attorney General of Canada
>>>
>>> For The Respondent / APPELLANT ON CROSS-APPEAL
>>>
>>>
>
September 20, 2021 General Election Election Results
https://www.ourcommons.ca/members/en/election-candidates#
Election Candidates
44th General Election - September 20, 2021
Results of the Monday, September 20, 2021, general election will remain unofficial until the Chief Electoral Officer has confirmed the name of the member of Parliament elected in each constituency.
The expected date for the return of the election writs is Monday, October 11, 2021.
For information on the election process, please consult the Elections Canada website.
Refine your search
2010 Results
| Province / Territory | Constituency | Candidate | Political Affiliation | Result |
|---|---|---|---|---|
| Alberta | Banff—Airdrie | Blum, Aidan | Green Party of Canada | Defeated (unconfirmed) |
| Alberta | Banff—Airdrie | Elnaga, Tariq | Maverick Party | Defeated (unconfirmed) |
| Alberta | Banff—Airdrie | Gamble, David | Liberal Party of Canada | Defeated (unconfirmed) |
| Alberta | Banff—Airdrie | O'Driscoll, Caroline | Independent | Defeated (unconfirmed) |
| Alberta | Banff—Airdrie | Richards, Blake | Conservative Party of Canada | Re-Elected (unconfirmed) |
| Alberta | Banff—Airdrie | Sloan, Derek | No Affiliation | Defeated (unconfirmed) |
| Alberta | Banff—Airdrie | Voss, Ron | Independent | Defeated (unconfirmed) |
| Alberta | Banff—Airdrie | Wellwood, Nadine | People's Party of Canada | Defeated (unconfirmed) |
| Alberta | Banff—Airdrie | Zagoda, Sarah | New Democratic Party | Defeated (unconfirmed) |
| Alberta | Battle River—Crowfoot | Brisbin, Daniel | Green Party of Canada | Defeated (unconfirmed) |
| Alberta | Battle River—Crowfoot | Golka, Jeffrey | Maverick Party | Defeated (unconfirmed) |
| Alberta | Battle River—Crowfoot | Irwin, John | Veterans Coalition Party of Canada | Defeated (unconfirmed) |
| Alberta | Battle River—Crowfoot | Kurek, Damien C. | Conservative Party of Canada | Re-Elected (unconfirmed) |
| Alberta | Battle River—Crowfoot | McLeod, Leah | Liberal Party of Canada | Defeated (unconfirmed) |
| Alberta | Battle River—Crowfoot | Ratushniak, Tonya | New Democratic Party | Defeated (unconfirmed) |
| Alberta | Battle River—Crowfoot | Trepanier, Dennis | People's Party of Canada | Defeated (unconfirmed) |
| Alberta | Bow River | Bliss, Orrin | Maverick Party | Defeated (unconfirmed) |
| Alberta | Bow River | Bridges, Jonathan | People's Party of Canada | Defeated (unconfirmed) |
| Alberta | Bow River | Lipp, Tom | Christian Heritage Party of Canada | Defeated (unconfirmed) |
| Alberta | Bow River | MacLean, Michael | New Democratic Party | Defeated (unconfirmed) |
| Alberta | Bow River | Shawile, Getahun | Liberal Party of Canada | Defeated (unconfirmed) |
| Alberta | Bow River | Shields, Martin | Conservative Party of Canada | Re-Elected (unconfirmed) |
| Alberta | Calgary Centre | Estevez Moreno, Juan | New Democratic Party | Defeated (unconfirmed) |
| Alberta | Calgary Centre | Grover, Sabrina | Liberal Party of Canada | Defeated (unconfirmed) |
| Alberta | Calgary Centre | McLean, Greg | Conservative Party of Canada | Re-Elected (unconfirmed) |
| Alberta | Calgary Centre | Mullins, Austin | Green Party of Canada | Defeated (unconfirmed) |
| Alberta | Calgary Centre | Pawlowski, Dawid | Christian Heritage Party of Canada | Defeated (unconfirmed) |
| Alberta | Calgary Confederation | Akter, Gulshan | New Democratic Party | Defeated (unconfirmed) |
| Alberta | Calgary Confederation | Gao, Edward | People's Party of Canada | Defeated (unconfirmed) |
| Alberta | Calgary Confederation | Hunter, Kevan | Marxist-Leninist Party of Canada | Defeated (unconfirmed) |
| Alberta | Calgary Confederation | Odd, Natalie | Green Party of Canada | Defeated (unconfirmed) |
| Alberta | Calgary Confederation | Sigler, Murray | Liberal Party of Canada | Defeated (unconfirmed) |
| Alberta | Calgary Confederation | Webber, Len | Conservative Party of Canada | Re-Elected (unconfirmed) |
| Alberta | Calgary Forest Lawn | Gunn, Keira | New Democratic Party | Defeated (unconfirmed) |
| Alberta | Calgary Forest Lawn | Hallan, Jasraj Singh | Conservative Party of Canada | Re-Elected (unconfirmed) |
| Alberta | Calgary Forest Lawn | Holub, Dwayne | People's Party of Canada | Defeated (unconfirmed) |
| Alberta | Calgary Forest Lawn | Rutherford, Carey | Green Party of Canada | Defeated (unconfirmed) |
| Alberta | Calgary Forest Lawn | Stein, Jordan | Liberal Party of Canada | Defeated (unconfirmed) |
| Alberta | Calgary Forest Lawn | Trautman, Jonathan | Communist Party of Canada | Defeated (unconfirmed) |
| Alberta | Calgary Heritage | Bedard, Bailey | People's Party of Canada | Defeated (unconfirmed) |
| Alberta | Calgary Heritage | Benzen, Bob | Conservative Party of Canada | Re-Elected (unconfirmed) |
| Alberta | Calgary Heritage | Dejewski, Mark | Parti Rhinocéros Party | Defeated (unconfirmed) |
| Alberta | Calgary Heritage | Forsyth, Scott | Liberal Party of Canada | Defeated (unconfirmed) |
| Alberta | Calgary Heritage | Freeman, Annelise | Maverick Party | Defeated (unconfirmed) |
| Alberta | Calgary Heritage | Johnson, Kathleen | New Democratic Party | Defeated (unconfirmed) |
| Alberta | Calgary Heritage | Labell, Malka | Green Party of Canada | Defeated (unconfirmed) |
| Alberta | Calgary Midnapore | Bhachu, Gurmit | New Democratic Party | Defeated (unconfirmed) |
| Alberta | Calgary Midnapore | Hagel, Jonathan | People's Party of Canada | Defeated (unconfirmed) |
| Alberta | Calgary Midnapore | Kusie, Stephanie | Conservative Party of Canada | Re-Elected (unconfirmed) |
| Alberta | Calgary Midnapore | Magolan, Mateusz (Matt) | Maverick Party | Defeated (unconfirmed) |
| Alberta | Calgary Midnapore | Pulsifer, Shaun | Green Party of Canada | Defeated (unconfirmed) |
| Alberta | Calgary Midnapore | Zafar, Zarnab | Liberal Party of Canada | Defeated (unconfirmed) |
| Alberta | Calgary Nose Hill | Ahmed, Newaz Khalis | New Democratic Party | Defeated (unconfirmed) |
| Alberta | Calgary Nose Hill | Askin, Margaret | Marxist-Leninist Party of Canada | Defeated (unconfirmed) |
| Alberta | Calgary Nose Hill | Dale-Walker, Jessica | Liberal Party of Canada | Defeated (unconfirmed) |
| Alberta | Calgary Nose Hill | Garvey, Stephen J | National Citizens Alliance of Canada | Defeated (unconfirmed) |
| Alberta | Calgary Nose Hill | Hansell, Judson | Green Party of Canada | Defeated (unconfirmed) |
| Alberta | Calgary Nose Hill | Heather, Larry R. | Christian Heritage Party of Canada | Defeated (unconfirmed) |
| Alberta | Calgary Nose Hill | Rempel Garner, Hon. Michelle | Conservative Party of Canada | Re-Elected (unconfirmed) |
| Alberta | Calgary Nose Hill | Scott, Kyle | People's Party of Canada | Defeated (unconfirmed) |
| Alberta | Calgary Nose Hill | Wang, Xinyan | Parti Rhinocéros Party | Defeated (unconfirmed) |
| Alberta | Calgary Rocky Ridge | Jabeen, Shahnaz | Liberal Party of Canada | Defeated (unconfirmed) |
| Alberta | Calgary Rocky Ridge | Kelly, Pat | Conservative Party of Canada | Re-Elected (unconfirmed) |
| Alberta | Calgary Rocky Ridge | Kieren, Jena | New Democratic Party | Defeated (unconfirmed) |
| Alberta | Calgary Rocky Ridge | MacLeod, Rory | People's Party of Canada | Defeated (unconfirmed) |
| Alberta | Calgary Rocky Ridge | Robinson, David | Maverick Party | Defeated (unconfirmed) |
| Alberta | Calgary Rocky Ridge | Wright, Catriona | Green Party of Canada | Defeated (unconfirmed) |
| Alberta | Calgary Shepard | Diaczok, Andrea | Maverick Party | Defeated (unconfirmed) |
| Alberta | Calgary Shepard | Halmo, Jesse | National Citizens Alliance of Canada | Defeated (unconfirmed) |
| Alberta | Calgary Shepard | Jessel, Rajinder | New Democratic Party | Defeated (unconfirmed) |
| Alberta | Calgary Shepard | Kmiec, Tom | Conservative Party of Canada | Re-Elected (unconfirmed) |
| Alberta | Calgary Shepard | Macdonald, Cameron | Liberal Party of Canada | Defeated (unconfirmed) |
| Alberta | Calgary Shepard | Muirhead, Konstantine | Independent | Defeated (unconfirmed) |
| Alberta | Calgary Shepard | Tanaka, Evelyn | Green Party of Canada | Defeated (unconfirmed) |
| Alberta | Calgary Shepard | Vaillant, Ron | People's Party of Canada | Defeated (unconfirmed) |
| Alberta | Calgary Signal Hill | Copp, Ajay | Maverick Party | Defeated (unconfirmed) |
| Alberta | Calgary Signal Hill | Corrigall, Keiran | Green Party of Canada | Defeated (unconfirmed) |
| Alberta | Calgary Signal Hill | Debrey, Nicholas | People's Party of Canada | Defeated (unconfirmed) |
| Alberta | Calgary Signal Hill | Duncan, Shawn | Liberal Party of Canada | Defeated (unconfirmed) |
| Alberta | Calgary Signal Hill | King, Patrick | New Democratic Party | Defeated (unconfirmed) |
| Alberta | Calgary Signal Hill | Liepert, Ron | Conservative Party of Canada | Re-Elected (unconfirmed) |
| Alberta | Calgary Skyview | Aquart, Leigh | Independent | Defeated (unconfirmed) |
| Alberta | Calgary Skyview | Blanchard, Daniel | Marxist-Leninist Party of Canada | Defeated (unconfirmed) |
| Alberta | Calgary Skyview | Chahal, Harnirjodh | Liberal Party of Canada | Elected (unconfirmed) |
| Alberta | Calgary Skyview | Dhillon, Harinder singh (Harry) | People's Party of Canada | Defeated (unconfirmed) |
| Alberta | Calgary Skyview | Gill, Gurinder Singh | New Democratic Party | Defeated (unconfirmed) |
| Alberta | Calgary Skyview | Rana, Nadeem | Centrist Party of Canada | Defeated (unconfirmed) |
| Alberta | Calgary Skyview | Sahota, Jag | Conservative Party of Canada | Defeated (unconfirmed) |
| Alberta | Calgary Skyview | So, Janna | Green Party of Canada | Defeated (unconfirmed) |
| Alberta | Edmonton Centre | Boissonnault, Randy | Liberal Party of Canada | Elected (unconfirmed) |
| Alberta | Edmonton Centre | Crocker, Brock | People's Party of Canada | Defeated (unconfirmed) |
| Alberta | Edmonton Centre | Cumming, James | Conservative Party of Canada | Defeated (unconfirmed) |
| Alberta | Edmonton Centre | Edwards, Merryn | Marxist-Leninist Party of Canada | Defeated (unconfirmed) |
| Alberta | Edmonton Centre | Keefe, Valerie | Libertarian Party of Canada | Defeated (unconfirmed) |
| Alberta | Edmonton Centre | MacKenzie, Heather | New Democratic Party | Defeated (unconfirmed) |
| Alberta | Edmonton Griesbach | Boykowich, Alex | Communist Party of Canada | Defeated (unconfirmed) |
| Alberta | Edmonton Griesbach | Desjarlais, Blake | New Democratic Party | Elected (unconfirmed) |
| Alberta | Edmonton Griesbach | Diotte, Kerry | Conservative Party of Canada | Defeated (unconfirmed) |
| Alberta | Edmonton Griesbach | Joyce, Mary | Marxist-Leninist Party of Canada | Defeated (unconfirmed) |
| Alberta | Edmonton Griesbach | Lau, Heather | Green Party of Canada | Defeated (unconfirmed) |
| Alberta | Edmonton Griesbach | Matty, Thomas | People's Party of Canada | Defeated (unconfirmed) |
| Alberta | Edmonton Griesbach | Mohamud, Habiba | Liberal Party of Canada | Defeated (unconfirmed) |
| Alberta | Edmonton Griesbach | Watson, Morgan | Libertarian Party of Canada | Defeated (unconfirmed) |
| Alberta | Edmonton Manning | Aboultaif, Ziad | Conservative Party of Canada | Re-Elected (unconfirmed) |
| Alberta | Edmonton Manning | Halvorson, Martin | People's Party of Canada | Defeated (unconfirmed) |
| Alberta | Edmonton Manning | Smith, Donna Lynn | Liberal Party of Canada | Defeated (unconfirmed) |
| Alberta | Edmonton Manning | St. Germain, Charmaine | New Democratic Party | Defeated (unconfirmed) |
| Alberta | Edmonton Manning | Vachon, André | Marxist-Leninist Party of Canada | Defeated (unconfirmed) |
| Alberta | Edmonton Mill Woods | Henderson, Benjamin | Liberal Party of Canada | Defeated (unconfirmed) |
| Alberta | Edmonton Mill Woods | Logan, Nigel | New Democratic Party | Defeated (unconfirmed) |
| Alberta | Edmonton Mill Woods | McCormack, Paul Edward | People's Party of Canada | Defeated (unconfirmed) |
| Alberta | Edmonton Mill Woods | Rankin, Naomi | Communist Party of Canada | Defeated (unconfirmed) |
| Alberta | Edmonton Mill Woods | Uppal, Hon. Tim | Conservative Party of Canada | Re-Elected (unconfirmed) |
| Alberta | Edmonton Riverbend | Chaudary, Tariq | Liberal Party of Canada | Defeated (unconfirmed) |
| Alberta | Edmonton Riverbend | Gray, Shawn | New Democratic Party | Defeated (unconfirmed) |
| Alberta | Edmonton Riverbend | Hoffman, Melanie | Green Party of Canada | Defeated (unconfirmed) |
| Alberta | Edmonton Riverbend | Jeneroux, Matt | Conservative Party of Canada | Re-Elected (unconfirmed) |
| Alberta | Edmonton Riverbend | Peace, Jennifer | People's Party of Canada | Defeated (unconfirmed) |
| Alberta | Edmonton Strathcona | Green, Kelly | Green Party of Canada | Defeated (unconfirmed) |
| Alberta | Edmonton Strathcona | Janke, Wesley | People's Party of Canada | Defeated (unconfirmed) |
| Alberta | Edmonton Strathcona | McPherson, Heather | New Democratic Party | Re-Elected (unconfirmed) |
| Alberta | Edmonton Strathcona | Mohamed, Hibo | Liberal Party of Canada | Defeated (unconfirmed) |
| Alberta | Edmonton Strathcona | Obasan, Olatunde | Conservative Party of Canada | Defeated (unconfirmed) |
| Alberta | Edmonton Strathcona | Stinson, Malcolm | Libertarian Party of Canada | Defeated (unconfirmed) |
| Alberta | Edmonton West | Brown, Adam Wilson | Liberal Party of Canada | Defeated (unconfirmed) |
| Alberta | Edmonton West | Hunter, Sandra | New Democratic Party | Defeated (unconfirmed) |
| Alberta | Edmonton West | Kinzel, Brent | People's Party of Canada | Defeated (unconfirmed) |
| Alberta | Edmonton West | McCauley, Kelly | Conservative Party of Canada | Re-Elected (unconfirmed) |
| Alberta | Edmonton West | Morton, Margaret | Marxist-Leninist Party of Canada | Defeated (unconfirmed) |
| Alberta | Edmonton—Wetaskiwin | Beauchamp, Tyler | People's Party of Canada | Defeated (unconfirmed) |
| Alberta | Edmonton—Wetaskiwin | Calliou, Travis | Veterans Coalition Party of Canada | Defeated (unconfirmed) |
| Alberta | Edmonton—Wetaskiwin | Charles, Hugo | New Democratic Party | Defeated (unconfirmed) |
| Alberta | Edmonton—Wetaskiwin | Lake, Hon. Mike | Conservative Party of Canada | Re-Elected (unconfirmed) |
| Alberta | Edmonton—Wetaskiwin | Thiering, Ronald | Liberal Party of Canada | Defeated (unconfirmed) |
| Alberta | Foothills | Barlow, John | Conservative Party of Canada | Re-Elected (unconfirmed) |
| Alberta | Foothills | Hunter, Daniel | People's Party of Canada | Defeated (unconfirmed) |
| Alberta | Foothills | Rogers, Brett | Green Party of Canada | Defeated (unconfirmed) |
| Alberta | Foothills | Shimp, Paula | Liberal Party of Canada | Defeated (unconfirmed) |
| Alberta | Foothills | Traxel, Mary-Ellen "Michelle" | New Democratic Party | Defeated (unconfirmed) |
| Alberta | Foothills | Wylie, Joshua | Maverick Party | Defeated (unconfirmed) |
| Alberta | Fort McMurray—Cold Lake | Abdi, Abdifatah | Liberal Party of Canada | Defeated (unconfirmed) |
| Alberta | Fort McMurray—Cold Lake | Deheer, Brian | Green Party of Canada | Defeated (unconfirmed) |
| Alberta | Fort McMurray—Cold Lake | Goodridge, Laila | Conservative Party of Canada | Elected (unconfirmed) |
| Alberta | Fort McMurray—Cold Lake | McDonald, Shawn | People's Party of Canada | Defeated (unconfirmed) |
| Alberta | Fort McMurray—Cold Lake | Meyers, Jonathan | Maverick Party | Defeated (unconfirmed) |
| Alberta | Fort McMurray—Cold Lake | Robinson, Garnett | New Democratic Party | Defeated (unconfirmed) |
| Alberta | Fort McMurray—Cold Lake | Whitmore, Hughie | Veterans Coalition Party of Canada | Defeated (unconfirmed) |
| Alberta | Grande Prairie—Mackenzie | Campbell, Dan | Liberal Party of Canada | Defeated (unconfirmed) |
| Alberta | Grande Prairie—Mackenzie | Eckstrom, Donovan | Parti Rhinocéros Party | Defeated (unconfirmed) |
| Alberta | Grande Prairie—Mackenzie | McLean, Shawn | People's Party of Canada | Defeated (unconfirmed) |
| Alberta | Grande Prairie—Mackenzie | Ralph, Ambrose | Maverick Party | Defeated (unconfirmed) |
| Alberta | Grande Prairie—Mackenzie | Villebrun, Jennifer | New Democratic Party | Defeated (unconfirmed) |
| Alberta | Grande Prairie—Mackenzie | Warkentin, Chris | Conservative Party of Canada | Re-Elected (unconfirmed) |
| Alberta | Lakeland | Bissonnette, Desiree | New Democratic Party | Defeated (unconfirmed) |
| Alberta | Lakeland | Brunner, Kira | Green Party of Canada | Defeated (unconfirmed) |
| Alberta | Lakeland | McCormack, Ann | People's Party of Canada | Defeated (unconfirmed) |
| Alberta | Lakeland | Sirett, Frederick | Maverick Party | Defeated (unconfirmed) |
| Alberta | Lakeland | Stubbs, Shannon | Conservative Party of Canada | Re-Elected (unconfirmed) |
| Alberta | Lakeland | Turvey, John | Liberal Party of Canada | Defeated (unconfirmed) |
| Alberta | Lethbridge | Capp, Geoffrey | Christian Heritage Party of Canada | Defeated (unconfirmed) |
| Alberta | Lethbridge | Harder, Rachael | Conservative Party of Canada | Re-Elected (unconfirmed) |
| Alberta | Lethbridge | Hargreaves, Devon | Liberal Party of Canada | Defeated (unconfirmed) |
| Alberta | Lethbridge | Hovan, Kimberley | People's Party of Canada | Defeated (unconfirmed) |
| Alberta | Lethbridge | Perez, Elaine | New Democratic Party | Defeated (unconfirmed) |
| Alberta | Lethbridge | Siever, Kim | Independent | Defeated (unconfirmed) |
| Alberta | Medicine Hat—Cardston—Warner | Bruisedhead, Diandra | Green Party of Canada | Defeated (unconfirmed) |
| Alberta | Medicine Hat—Cardston—Warner | Heidinger, Brodie | People's Party of Canada | Defeated (unconfirmed) |
| Alberta | Medicine Hat—Cardston—Warner | Johnson, Jocelyn | New Democratic Party | Defeated (unconfirmed) |
| Alberta | Medicine Hat—Cardston—Warner | Motz, Glen | Conservative Party of Canada | Re-Elected (unconfirmed) |
| Alberta | Medicine Hat—Cardston—Warner | Shoesmith, Geoff | Maverick Party | Defeated (unconfirmed) |
| Alberta | Medicine Hat—Cardston—Warner | Wilson, Hannah | Liberal Party of Canada | Defeated (unconfirmed) |
| Alberta | Peace River—Westlock | Boisson, Darryl | People's Party of Canada | Defeated (unconfirmed) |
| Alberta | Peace River—Westlock | Krieger, Colin | Maverick Party | Defeated (unconfirmed) |
| Alberta | Peace River—Westlock | MacDougall, Jordan | Green Party of Canada | Defeated (unconfirmed) |
| Alberta | Peace River—Westlock | Penny, Leslie | Liberal Party of Canada | Defeated (unconfirmed) |
| Alberta | Peace River—Westlock | Ungstad, Gail | New Democratic Party | Defeated (unconfirmed) |
| Alberta | Peace River—Westlock | Viersen, Arnold | Conservative Party of Canada | Re-Elected (unconfirmed) |
| Alberta | Red Deer—Lacombe | Barnes, Joan | No Affiliation | Defeated (unconfirmed) |
| Alberta | Red Deer—Lacombe | Calkins, Blaine | Conservative Party of Canada | Re-Elected (unconfirmed) |
| Alberta | Red Deer—Lacombe | Heyden-Kaye, Tanya | New Democratic Party | Defeated (unconfirmed) |
| Alberta | Red Deer—Lacombe | Joujan, Harold | Maverick Party | Defeated (unconfirmed) |
| Alberta | Red Deer—Lacombe | Lim, Megan | People's Party of Canada | Defeated (unconfirmed) |
| Alberta | Red Deer—Lacombe | Ondieki, David | Liberal Party of Canada | Defeated (unconfirmed) |
| Alberta | Red Deer—Lacombe | Watson, Matthew | Libertarian Party of Canada | Defeated (unconfirmed) |
| Alberta | Red Deer—Mountain View | Adewumi, Olumide | Liberal Party of Canada | Defeated (unconfirmed) |
| Alberta | Red Deer—Mountain View | Dreeshen, Earl | Conservative Party of Canada | Re-Elected (unconfirmed) |
| Alberta | Red Deer—Mountain View | Grabowski, Marie | New Democratic Party | Defeated (unconfirmed) |
| Alberta | Red Deer—Mountain View | Lorencz, Kelly | People's Party of Canada | Defeated (unconfirmed) |
| Alberta | Red Deer—Mountain View | Pilon, Jared | Libertarian Party of Canada | Defeated (unconfirmed) |
| Alberta | Red Deer—Mountain View | Wilcox, Mark | Maverick Party | Defeated (unconfirmed) |
| Alberta | Red Deer—Mountain View | Willington, Clayten | Independent | Defeated (unconfirmed) |
| Alberta | Sherwood Park—Fort Saskatchewan | Genuis, Garnett | Conservative Party of Canada | Re-Elected (unconfirmed) |
| Alberta | Sherwood Park—Fort Saskatchewan | Holm, Tanya | Liberal Party of Canada | Defeated (unconfirmed) |
| Alberta | Sherwood Park—Fort Saskatchewan | Newberry, Todd | Maverick Party | Defeated (unconfirmed) |
| Alberta | Sherwood Park—Fort Saskatchewan | Perris, Sheldon Jonah | Green Party of Canada | Defeated (unconfirmed) |
| Alberta | Sherwood Park—Fort Saskatchewan | Simpson, Charles | Independent | Defeated (unconfirmed) |
| Alberta | Sherwood Park—Fort Saskatchewan | Theroux, Aidan | New Democratic Party | Defeated (unconfirmed) |
| Alberta | Sherwood Park—Fort Saskatchewan | Wetterstrand, John | People's Party of Canada | Defeated (unconfirmed) |
| Alberta | St. Albert—Edmonton | Cecelia, Brigitte | People's Party of Canada | Defeated (unconfirmed) |
| Alberta | St. Albert—Edmonton | Cooper, Michael | Conservative Party of Canada | Re-Elected (unconfirmed) |
| Alberta | St. Albert—Edmonton | Mpulubusi, Kathleen | New Democratic Party | Defeated (unconfirmed) |
| Alberta | St. Albert—Edmonton | Springate, Gregory | Liberal Party of Canada | Defeated (unconfirmed) |
| Alberta | Sturgeon River—Parkland | Dunham, Jeffrey | Maverick Party | Defeated (unconfirmed) |
| Alberta | Sturgeon River—Parkland | Lloyd, Dane | Conservative Party of Canada | Re-Elected (unconfirmed) |
| Alberta | Sturgeon River—Parkland | MacKinnon, Murray | People's Party of Canada | Defeated (unconfirmed) |
| Alberta | Sturgeon River—Parkland | Mills, Kendra | New Democratic Party | Defeated (unconfirmed) |
| Alberta | Sturgeon River—Parkland | Walker, Irene | Liberal Party of Canada | Defeated (unconfirmed) |
| Alberta | Sturgeon River—Parkland | Willerton, Jeffrey | Christian Heritage Party of Canada | Defeated (unconfirmed) |
| Alberta | Yellowhead | Francey, Gordon | Veterans Coalition Party of Canada | Defeated (unconfirmed) |
| Alberta | Yellowhead | Manchen, Michael | People's Party of Canada | Defeated (unconfirmed) |
| Alberta | Yellowhead | Muir, Robert | Maverick Party | Defeated (unconfirmed) |
| Alberta | Yellowhead | Roy, Guillaume | New Democratic Party | Defeated (unconfirmed) |
| Alberta | Yellowhead | Schumacher, Sheila | Liberal Party of Canada | Defeated (unconfirmed) |
| Alberta | Yellowhead | Soroka, Gerald | Conservative Party of Canada | Re-Elected (unconfirmed) |
| British Columbia | Abbotsford | Fast, Hon. Ed | Conservative Party of Canada | Re-Elected (unconfirmed) |
| British Columbia | Abbotsford | Fowler, Stephen | Green Party of Canada | Defeated (unconfirmed) |
| British Columbia | Abbotsford | Gill, Navreen | Liberal Party of Canada | Defeated (unconfirmed) |
| British Columbia | Abbotsford | Sinclair, Kevin | People's Party of Canada | Defeated (unconfirmed) |
| British Columbia | Abbotsford | Yakandawela, Dharmasena | New Democratic Party | Defeated (unconfirmed) |
| British Columbia | Burnaby North—Seymour | Beech, Terry | Liberal Party of Canada | Re-Elected (unconfirmed) |
| British Columbia | Burnaby North—Seymour | Dolling, Peter | Green Party of Canada | Defeated (unconfirmed) |
| British Columbia | Burnaby North—Seymour | Hanson, James | New Democratic Party | Defeated (unconfirmed) |
| British Columbia | Burnaby North—Seymour | Nickerson, Bradley | People's Party of Canada | Defeated (unconfirmed) |
| British Columbia | Burnaby North—Seymour | Shein, Kelsey | Conservative Party of Canada | Defeated (unconfirmed) |
| British Columbia | Burnaby South | Curran, Maureen | Green Party of Canada | Defeated (unconfirmed) |
| British Columbia | Burnaby South | Kendell, Martin | Independent | Defeated (unconfirmed) |
| British Columbia | Burnaby South | Lavji, Lyakatali | Conservative Party of Canada | Defeated (unconfirmed) |
| British Columbia | Burnaby South | Sami, Brea Huang | Liberal Party of Canada | Defeated (unconfirmed) |
| British Columbia | Burnaby South | Singh, Jagmeet | New Democratic Party | Re-Elected (unconfirmed) |
| British Columbia | Burnaby South | Williams, Marcella | People's Party of Canada | Defeated (unconfirmed) |
| British Columbia | Cariboo—Prince George | Doherty, Todd | Conservative Party of Canada | Re-Elected (unconfirmed) |
| British Columbia | Cariboo—Prince George | Frizzell, Garth | Liberal Party of Canada | Defeated (unconfirmed) |
| British Columbia | Cariboo—Prince George | Gustafson, Jeremy | People's Party of Canada | Defeated (unconfirmed) |
| British Columbia | Cariboo—Prince George | Hunsinger-Chang, Leigh | Green Party of Canada | Defeated (unconfirmed) |
| British Columbia | Cariboo—Prince George | McKinnon, Audrey | New Democratic Party | Defeated (unconfirmed) |
| British Columbia | Cariboo—Prince George | Thiessen, Henry | Christian Heritage Party of Canada | Defeated (unconfirmed) |
| British Columbia | Central Okanagan—Similkameen—Nicola | Albas, Dan | Conservative Party of Canada | Re-Elected (unconfirmed) |
| British Columbia | Central Okanagan—Similkameen—Nicola | Eves, Sarah | Liberal Party of Canada | Defeated (unconfirmed) |
| British Columbia | Central Okanagan—Similkameen—Nicola | Mcdonald, Kathryn | People's Party of Canada | Defeated (unconfirmed) |
| British Columbia | Central Okanagan—Similkameen—Nicola | Phillip, Joan C. | New Democratic Party | Defeated (unconfirmed) |
| British Columbia | Central Okanagan—Similkameen—Nicola | Wauters, Brennan | Green Party of Canada | Defeated (unconfirmed) |
| British Columbia | Chilliwack—Hope | Bogunovic, Robert | People's Party of Canada | Defeated (unconfirmed) |
| British Columbia | Chilliwack—Hope | Green, Arthur Alexander | Green Party of Canada | Defeated (unconfirmed) |
| British Columbia | Chilliwack—Hope | Pohl, Danielle | New Democratic Party | Defeated (unconfirmed) |
| British Columbia | Chilliwack—Hope | Strahl, Mark | Conservative Party of Canada | Re-Elected (unconfirmed) |
| British Columbia | Chilliwack—Hope | Velonis, Kelly | Liberal Party of Canada | Defeated (unconfirmed) |
| British Columbia | Cloverdale—Langley City | Aldag, John | Liberal Party of Canada | Elected (unconfirmed) |
| British Columbia | Cloverdale—Langley City | Jansen, Tamara | Conservative Party of Canada | Defeated (unconfirmed) |
| British Columbia | Cloverdale—Langley City | Jayaprakash, Rajesh | New Democratic Party | Defeated (unconfirmed) |
| British Columbia | Cloverdale—Langley City | Kennedy, Ian | People's Party of Canada | Defeated (unconfirmed) |
| British Columbia | Coquitlam—Port Coquitlam | Anastasiadis, Katerina | Conservative Party of Canada | Defeated (unconfirmed) |
| British Columbia | Coquitlam—Port Coquitlam | Brundell, Kimberly | People's Party of Canada | Defeated (unconfirmed) |
| British Columbia | Coquitlam—Port Coquitlam | Dupont, Laura | New Democratic Party | Defeated (unconfirmed) |
| British Columbia | Coquitlam—Port Coquitlam | McKinnon, Ron | Liberal Party of Canada | Re-Elected (unconfirmed) |
| British Columbia | Courtenay—Alberni | Biley, Barbara | Marxist-Leninist Party of Canada | Defeated (unconfirmed) |
| British Columbia | Courtenay—Alberni | Eppich, Robert | People's Party of Canada | Defeated (unconfirmed) |
| British Columbia | Courtenay—Alberni | Farlinger, Susan | Liberal Party of Canada | Defeated (unconfirmed) |
| British Columbia | Courtenay—Alberni | Hare, Susan | Green Party of Canada | Defeated (unconfirmed) |
| British Columbia | Courtenay—Alberni | Johns, Gord | New Democratic Party | Re-Elected (unconfirmed) |
| British Columbia | Courtenay—Alberni | Lee, Mary | Conservative Party of Canada | Defeated (unconfirmed) |
| British Columbia | Cowichan—Malahat—Langford | DeLong, Alana | Conservative Party of Canada | Defeated (unconfirmed) |
| British Columbia | Cowichan—Malahat—Langford | Hecht, Mark | People's Party of Canada | Defeated (unconfirmed) |
| British Columbia | Cowichan—Malahat—Langford | Herbert, Blair | Liberal Party of Canada | Defeated (unconfirmed) |
| British Columbia | Cowichan—Malahat—Langford | MacGregor, Alistair | New Democratic Party | Re-Elected (unconfirmed) |
| British Columbia | Cowichan—Malahat—Langford | Versaevel, Lia Marie Constance | Green Party of Canada | Defeated (unconfirmed) |
| British Columbia | Delta | Dean, Monika | New Democratic Party | Defeated (unconfirmed) |
| British Columbia | Delta | Pan, Hong Yan | Independent | Defeated (unconfirmed) |
| British Columbia | Delta | Qualtrough, Hon. Carla | Liberal Party of Canada | Re-Elected (unconfirmed) |
| British Columbia | Delta | Shearer, Garry | Conservative Party of Canada | Defeated (unconfirmed) |
| British Columbia | Delta | Smith, Jeremy | Green Party of Canada | Defeated (unconfirmed) |
| British Columbia | Delta | Tarasenko, Paul | People's Party of Canada | Defeated (unconfirmed) |
| British Columbia | Esquimalt—Saanich—Sooke | Anderson, Robert Floyd Stanley | People's Party of Canada | Defeated (unconfirmed) |
| British Columbia | Esquimalt—Saanich—Sooke | Frost, Laura Anne | Conservative Party of Canada | Defeated (unconfirmed) |
| British Columbia | Esquimalt—Saanich—Sooke | Garrison, Randall | New Democratic Party | Re-Elected (unconfirmed) |
| British Columbia | Esquimalt—Saanich—Sooke | Gordon, Harley | Green Party of Canada | Defeated (unconfirmed) |
| British Columbia | Esquimalt—Saanich—Sooke | Kobayashi, Douglas | Liberal Party of Canada | Defeated (unconfirmed) |
| British Columbia | Esquimalt—Saanich—Sooke | Strandlund, Tyson | Communist Party of Canada | Defeated (unconfirmed) |
| British Columbia | Fleetwood—Port Kells | Birring, Amrit | People's Party of Canada | Defeated (unconfirmed) |
| British Columbia | Fleetwood—Port Kells | DeNure, Livingstone Royal Perry | Green Party of Canada | Defeated (unconfirmed) |
| British Columbia | Fleetwood—Port Kells | Hardie, Ken | Liberal Party of Canada | Re-Elected (unconfirmed) |
| British Columbia | Fleetwood—Port Kells | Hayer, Dave | Conservative Party of Canada | Defeated (unconfirmed) |
| British Columbia | Fleetwood—Port Kells | Krishnan, Murali | Independent | Defeated (unconfirmed) |
| British Columbia | Fleetwood—Port Kells | Toor, Raji | New Democratic Party | Defeated (unconfirmed) |
| British Columbia | Kamloops—Thompson—Cariboo | Allan, Wayne | Independent | Defeated (unconfirmed) |
| British Columbia | Kamloops—Thompson—Cariboo | Caputo, Frank | Conservative Party of Canada | Elected (unconfirmed) |
| British Columbia | Kamloops—Thompson—Cariboo | Currie, Iain | Green Party of Canada | Defeated (unconfirmed) |
| British Columbia | Kamloops—Thompson—Cariboo | Delwo, Corally | People's Party of Canada | Defeated (unconfirmed) |
| British Columbia | Kamloops—Thompson—Cariboo | McCormick, Jesse | Liberal Party of Canada | Defeated (unconfirmed) |
| British Columbia | Kamloops—Thompson—Cariboo | O'Brien, Robert | Independent | Defeated (unconfirmed) |
| British Columbia | Kamloops—Thompson—Cariboo | Sundhu, Balwinder | New Democratic Party | Defeated (unconfirmed) |
| British Columbia | Kelowna—Lake Country | Desjarlais, Cade | New Democratic Party | Defeated (unconfirmed) |
| British Columbia | Kelowna—Lake Country | Gray, Tracy | Conservative Party of Canada | Re-Elected (unconfirmed) |
| British Columbia | Kelowna—Lake Country | Krupa, Tim | Liberal Party of Canada | Defeated (unconfirmed) |
| British Columbia | Kelowna—Lake Country | Rogers, Brian | People's Party of Canada | Defeated (unconfirmed) |
| British Columbia | Kelowna—Lake Country | Szeman, Imre | Green Party of Canada | Defeated (unconfirmed) |
| British Columbia | Kootenay—Columbia | Bennett, Sarah | People's Party of Canada | Defeated (unconfirmed) |
| British Columbia | Kootenay—Columbia | Goldsbury, Robin | Liberal Party of Canada | Defeated (unconfirmed) |
| British Columbia | Kootenay—Columbia | Morrison, Rob | Conservative Party of Canada | Re-Elected (unconfirmed) |
| British Columbia | Kootenay—Columbia | Nelson, Rana | Green Party of Canada | Defeated (unconfirmed) |
| British Columbia | Kootenay—Columbia | Stetski, Wayne | New Democratic Party | Defeated (unconfirmed) |
| British Columbia | Langley—Aldergrove | Boychuk, Rayna | People's Party of Canada | Defeated (unconfirmed) |
| British Columbia | Langley—Aldergrove | Chang, Michael | New Democratic Party | Defeated (unconfirmed) |
| British Columbia | Langley—Aldergrove | Farstad, Kaija | Green Party of Canada | Defeated (unconfirmed) |
| British Columbia | Langley—Aldergrove | Richter, Kimberly Anne | Liberal Party of Canada | Defeated (unconfirmed) |
| British Columbia | Langley—Aldergrove | Van Popta, Tako | Conservative Party of Canada | Re-Elected (unconfirmed) |
| British Columbia | Mission—Matsqui—Fraser Canyon | Bellay, Nicole | Green Party of Canada | Defeated (unconfirmed) |
| British Columbia | Mission—Matsqui—Fraser Canyon | Grewal, Guneet | Liberal Party of Canada | Defeated (unconfirmed) |
| British Columbia | Mission—Matsqui—Fraser Canyon | Niles, Tyler | People's Party of Canada | Defeated (unconfirmed) |
| British Columbia | Mission—Matsqui—Fraser Canyon | Perrin, Lynn | New Democratic Party | Defeated (unconfirmed) |
| British Columbia | Mission—Matsqui—Fraser Canyon | Vis, Brad | Conservative Party of Canada | Re-Elected (unconfirmed) |
| British Columbia | Nanaimo—Ladysmith | Barron, Lisa Marie | New Democratic Party | Elected (unconfirmed) |
| British Columbia | Nanaimo—Ladysmith | Corfield, Michelle | Liberal Party of Canada | Defeated (unconfirmed) |
| British Columbia | Nanaimo—Ladysmith | Kronis, Tamara | Conservative Party of Canada | Defeated (unconfirmed) |
| British Columbia | Nanaimo—Ladysmith | Manly, Paul | Green Party of Canada | Defeated (unconfirmed) |
| British Columbia | Nanaimo—Ladysmith | Welton, Stephen | People's Party of Canada | Defeated (unconfirmed) |
| British Columbia | New Westminster—Burnaby | Heide, Kevin | People's Party of Canada | Defeated (unconfirmed) |
| British Columbia | New Westminster—Burnaby | Jaffer, Rozina | Liberal Party of Canada | Defeated (unconfirmed) |
| British Columbia | New Westminster—Burnaby | Julian, Peter | New Democratic Party | Re-Elected (unconfirmed) |
| British Columbia | New Westminster—Burnaby | Macdonald, David | Green Party of Canada | Defeated (unconfirmed) |
| British Columbia | New Westminster—Burnaby | Munro, Paige | Conservative Party of Canada | Defeated (unconfirmed) |
| British Columbia | North Island—Powell River | Blaney, Rachel | New Democratic Party | Re-Elected (unconfirmed) |
| British Columbia | North Island—Powell River | Downey, Shelley | Conservative Party of Canada | Defeated (unconfirmed) |
| British Columbia | North Island—Powell River | Gastis, Stacey | Maverick Party | Defeated (unconfirmed) |
| British Columbia | North Island—Powell River | Grenz, Jennifer | Liberal Party of Canada | Defeated (unconfirmed) |
| British Columbia | North Island—Powell River | Macknight, Paul | People's Party of Canada | Defeated (unconfirmed) |
| British Columbia | North Island—Powell River | Neal, Carla | Marxist-Leninist Party of Canada | Defeated (unconfirmed) |
| British Columbia | North Island—Powell River | Wegg, Jessica | Green Party of Canada | Defeated (unconfirmed) |
| British Columbia | North Okanagan—Shuswap | Arnold, Mel | Conservative Party of Canada | Re-Elected (unconfirmed) |
| British Columbia | North Okanagan—Shuswap | Delfing, Kyle | People's Party of Canada | Defeated (unconfirmed) |
| British Columbia | North Okanagan—Shuswap | Desautels, Shelley | Liberal Party of Canada | Defeated (unconfirmed) |
| British Columbia | North Okanagan—Shuswap | Gunner, Andrea | Green Party of Canada | Defeated (unconfirmed) |
| British Columbia | North Okanagan—Shuswap | Johnston, Ronald | New Democratic Party | Defeated (unconfirmed) |
| British Columbia | North Vancouver | Bentz, Tammy | New Democratic Party | Defeated (unconfirmed) |
| British Columbia | North Vancouver | Galloway, John | People's Party of Canada | Defeated (unconfirmed) |
| British Columbia | North Vancouver | Jickling, Les | Conservative Party of Canada | Defeated (unconfirmed) |
| British Columbia | North Vancouver | Kaario, Archie Leo Bruno | Green Party of Canada | Defeated (unconfirmed) |
| British Columbia | North Vancouver | Wilkinson, Hon. Jonathan | Liberal Party of Canada | Re-Elected (unconfirmed) |
| British Columbia | Pitt Meadows—Maple Ridge | Buddle, Peter | Parti Rhinocéros Party | Defeated (unconfirmed) |
| British Columbia | Pitt Meadows—Maple Ridge | Dalton, Marc | Conservative Party of Canada | Re-Elected (unconfirmed) |
| British Columbia | Pitt Meadows—Maple Ridge | Hoffmann, Juliuss | People's Party of Canada | Defeated (unconfirmed) |
| British Columbia | Pitt Meadows—Maple Ridge | Klapwyk, Philip Raymond | New Democratic Party | Defeated (unconfirmed) |
| British Columbia | Pitt Meadows—Maple Ridge | Ranta, Steven | Independent | Defeated (unconfirmed) |
| British Columbia | Pitt Meadows—Maple Ridge | Yousef, Ahmed | Liberal Party of Canada | Defeated (unconfirmed) |
| British Columbia | Port Moody—Coquitlam | Davis, William Michael | Liberal Party of Canada | Defeated (unconfirmed) |
| British Columbia | Port Moody—Coquitlam | McPherson, Desta | People's Party of Canada | Defeated (unconfirmed) |
| British Columbia | Port Moody—Coquitlam | Shin, Nelly | Conservative Party of Canada | Defeated (unconfirmed) |
| British Columbia | Port Moody—Coquitlam | Verrier, Roland | Marxist-Leninist Party of Canada | Defeated (unconfirmed) |
| British Columbia | Port Moody—Coquitlam | Zarrillo, Bonita | New Democratic Party | Elected (unconfirmed) |
| British Columbia | Prince George—Peace River—Northern Rockies | Alavi, Amir | Liberal Party of Canada | Defeated (unconfirmed) |
| British Columbia | Prince George—Peace River—Northern Rockies | Dyck, Ryan | People's Party of Canada | Defeated (unconfirmed) |
| British Columbia | Prince George—Peace River—Northern Rockies | Hewkin, Phil | Canada's Fourth Front | Defeated (unconfirmed) |
| British Columbia | Prince George—Peace River—Northern Rockies | Jeffers, David | Maverick Party | Defeated (unconfirmed) |
| British Columbia | Prince George—Peace River—Northern Rockies | Kendall, Catharine | Green Party of Canada | Defeated (unconfirmed) |
| British Columbia | Prince George—Peace River—Northern Rockies | Longley, Cory | New Democratic Party | Defeated (unconfirmed) |
| British Columbia | Prince George—Peace River—Northern Rockies | Zimmer, Bob | Conservative Party of Canada | Re-Elected (unconfirmed) |
| British Columbia | Richmond Centre | Gillanders, Laura | Green Party of Canada | Defeated (unconfirmed) |
| British Columbia | Richmond Centre | Hinton, James | People's Party of Canada | Defeated (unconfirmed) |
| British Columbia | Richmond Centre | Miao, Chung An Wilson | Liberal Party of Canada | Elected (unconfirmed) |
| British Columbia | Richmond Centre | Nixon, Sandra | New Democratic Party | Defeated (unconfirmed) |
| British Columbia | Richmond Centre | Wong, Hon. Alice | Conservative Party of Canada | Defeated (unconfirmed) |
| British Columbia | Saanich—Gulf Islands | Busch, David | Conservative Party of Canada | Defeated (unconfirmed) |
| British Columbia | Saanich—Gulf Islands | Currie, Dock | Communist Party of Canada | Defeated (unconfirmed) |
| British Columbia | Saanich—Gulf Islands | Hilderman, David | People's Party of Canada | Defeated (unconfirmed) |
| British Columbia | Saanich—Gulf Islands | May, Elizabeth | Green Party of Canada | Re-Elected (unconfirmed) |
| British Columbia | Saanich—Gulf Islands | Moore-Arbour, Sherri | Liberal Party of Canada | Defeated (unconfirmed) |
| British Columbia | Saanich—Gulf Islands | Singh, Sabina | New Democratic Party | Defeated (unconfirmed) |
| British Columbia | Skeena—Bulkley Valley | Bachrach, Taylor | New Democratic Party | Re-Elected (unconfirmed) |
| British Columbia | Skeena—Bulkley Valley | Craven, Jody | People's Party of Canada | Defeated (unconfirmed) |
| British Columbia | Skeena—Bulkley Valley | Jhaj, Lakhwinder | Liberal Party of Canada | Defeated (unconfirmed) |
| British Columbia | Skeena—Bulkley Valley | Rattée, Claire | Conservative Party of Canada | Defeated (unconfirmed) |
| British Columbia | Skeena—Bulkley Valley | Taylor, Rodney | Christian Heritage Party of Canada | Defeated (unconfirmed) |
| British Columbia | Skeena—Bulkley Valley | Young, Adeana | Green Party of Canada | Defeated (unconfirmed) |
| British Columbia | South Okanagan—West Kootenay | Cannings, Richard | New Democratic Party | Re-Elected (unconfirmed) |
| British Columbia | South Okanagan—West Kootenay | Howse, Tara | Green Party of Canada | Defeated (unconfirmed) |
| British Columbia | South Okanagan—West Kootenay | Konanz, Helena | Conservative Party of Canada | Defeated (unconfirmed) |
| British Columbia | South Okanagan—West Kootenay | Robertson, Ken | Liberal Party of Canada | Defeated (unconfirmed) |
| British Columbia | South Okanagan—West Kootenay | Taylor, Sean | People's Party of Canada | Defeated (unconfirmed) |
| British Columbia | South Surrey—White Rock | Findlay, Hon. Kerry-Lynne D. | Conservative Party of Canada | Re-Elected (unconfirmed) |
| British Columbia | South Surrey—White Rock | Hogg, Gordie | Liberal Party of Canada | Defeated (unconfirmed) |
| British Columbia | South Surrey—White Rock | Jensen, Gary | People's Party of Canada | Defeated (unconfirmed) |
| British Columbia | South Surrey—White Rock | Liu, Yen-Chun | New Democratic Party | Defeated (unconfirmed) |
| British Columbia | Steveston—Richmond East | Bains, Paramvir | Liberal Party of Canada | Elected (unconfirmed) |
| British Columbia | Steveston—Richmond East | Chiu, Kenny | Conservative Party of Canada | Defeated (unconfirmed) |
| British Columbia | Steveston—Richmond East | Raunet, Françoise | Green Party of Canada | Defeated (unconfirmed) |
| British Columbia | Steveston—Richmond East | Singh, Jennifer | People's Party of Canada | Defeated (unconfirmed) |
| British Columbia | Steveston—Richmond East | Trovato, Gabriel Joaquin | New Democratic Party | Defeated (unconfirmed) |
| British Columbia | Surrey Centre | Abbott, Ryan | Communist Party of Canada | Defeated (unconfirmed) |
| British Columbia | Surrey Centre | Bains, Tina | Conservative Party of Canada | Defeated (unconfirmed) |
| British Columbia | Surrey Centre | Bilkhu, Sonia | New Democratic Party | Defeated (unconfirmed) |
| British Columbia | Surrey Centre | Kennedy, Joseph | People's Party of Canada | Defeated (unconfirmed) |
| British Columbia | Surrey Centre | Kongyuy, Felix | Green Party of Canada | Defeated (unconfirmed) |
| British Columbia | Surrey Centre | Pielak, Kevin | Christian Heritage Party of Canada | Defeated (unconfirmed) |
| British Columbia | Surrey Centre | Sarai, Randeep | Liberal Party of Canada | Re-Elected (unconfirmed) |
| British Columbia | Surrey—Newton | Dhaliwal, Sukh | Liberal Party of Canada | Re-Elected (unconfirmed) |
| British Columbia | Surrey—Newton | Hundal, Parveer | Independent | Defeated (unconfirmed) |
| British Columbia | Surrey—Newton | Johal, Avneet Singh | New Democratic Party | Defeated (unconfirmed) |
| British Columbia | Surrey—Newton | Mohsin, Syed | Conservative Party of Canada | Defeated (unconfirmed) |
| British Columbia | Surrey—Newton | Singh, Pamela | People's Party of Canada | Defeated (unconfirmed) |
| British Columbia | Vancouver Centre | Cockell, Harry | Conservative Party of Canada | Defeated (unconfirmed) |
| British Columbia | Vancouver Centre | Fry, Hon. Hedy | Liberal Party of Canada | Re-Elected (unconfirmed) |
| British Columbia | Vancouver Centre | Ouellette, Breen | New Democratic Party | Defeated (unconfirmed) |
| British Columbia | Vancouver Centre | Paivarinta, Alaric | Green Party of Canada | Defeated (unconfirmed) |
| British Columbia | Vancouver Centre | Singleton-Fookes, Taylor | People's Party of Canada | Defeated (unconfirmed) |
| British Columbia | Vancouver East | Buday, Gölök Z | Libertarian Party of Canada | Defeated (unconfirmed) |
| British Columbia | Vancouver East | Francis, Mauro | Conservative Party of Canada | Defeated (unconfirmed) |
| British Columbia | Vancouver East | Hale, Natasha | Communist Party of Canada | Defeated (unconfirmed) |
| British Columbia | Vancouver East | Kwan, Jenny | New Democratic Party | Re-Elected (unconfirmed) |
| British Columbia | Vancouver East | Litzcke, Karin | People's Party of Canada | Defeated (unconfirmed) |
| British Columbia | Vancouver East | Matthew, Cheryl | Green Party of Canada | Defeated (unconfirmed) |
| British Columbia | Vancouver East | Vander Vies, Joshua | Liberal Party of Canada | Defeated (unconfirmed) |
| British Columbia | Vancouver Granville | Appadurai, Anjali | New Democratic Party | Defeated (unconfirmed) |
| British Columbia | Vancouver Granville | Che, Kailin | Conservative Party of Canada | Defeated (unconfirmed) |
| British Columbia | Vancouver Granville | Jewett, Damian | People's Party of Canada | Defeated (unconfirmed) |
| British Columbia | Vancouver Granville | Noormohamed, Taleeb | Liberal Party of Canada | Elected (unconfirmed) |
| British Columbia | Vancouver Granville | Popat, Imtiaz | Green Party of Canada | Defeated (unconfirmed) |
| British Columbia | Vancouver Kingsway | Binda, Carson | Conservative Party of Canada | Defeated (unconfirmed) |
| British Columbia | Vancouver Kingsway | Cariou, Kimball | Communist Party of Canada | Defeated (unconfirmed) |
| British Columbia | Vancouver Kingsway | Chishtie, Farrukh | Green Party of Canada | Defeated (unconfirmed) |
| British Columbia | Vancouver Kingsway | Davies, Don | New Democratic Party | Re-Elected (unconfirmed) |
| British Columbia | Vancouver Kingsway | MacKenzie, Jeremy | People's Party of Canada | Defeated (unconfirmed) |
| British Columbia | Vancouver Kingsway | Matabang Bremner, Virginia | Liberal Party of Canada | Defeated (unconfirmed) |
| British Columbia | Vancouver Kingsway | Petersen, Donna | Marxist-Leninist Party of Canada | Defeated (unconfirmed) |
| British Columbia | Vancouver Quadra | Abenes, Naden | New Democratic Party | Defeated (unconfirmed) |
| British Columbia | Vancouver Quadra | Armstrong, Stafford Bradley | Conservative Party of Canada | Defeated (unconfirmed) |
| British Columbia | Vancouver Quadra | Murray, Hon. Joyce | Liberal Party of Canada | Re-Elected (unconfirmed) |
| British Columbia | Vancouver Quadra | Siekmann, Renate | People's Party of Canada | Defeated (unconfirmed) |
| British Columbia | Vancouver Quadra | Singh, Devyani | Green Party of Canada | Defeated (unconfirmed) |
| British Columbia | Vancouver South | Cook, Anthony | People's Party of Canada | Defeated (unconfirmed) |
| British Columbia | Vancouver South | Gill, Sukhbir Singh | Conservative Party of Canada | Defeated (unconfirmed) |
| British Columbia | Vancouver South | Jamieson, Anne | Marxist-Leninist Party of Canada | Defeated (unconfirmed) |
| British Columbia | Vancouver South | McQuillan, Sean | New Democratic Party | Defeated (unconfirmed) |
| British Columbia | Vancouver South | Sajjan, Hon. Harjit S. | Liberal Party of Canada | Re-Elected (unconfirmed) |
| British Columbia | Victoria | Collins, Laurel | New Democratic Party | Re-Elected (unconfirmed) |
| British Columbia | Victoria | Hodson, Hannah | Conservative Party of Canada | Defeated (unconfirmed) |
| British Columbia | Victoria | Loughton, Nicholas | Green Party of Canada | Defeated (unconfirmed) |
| British Columbia | Victoria | Macdonald, Nicol | Liberal Party of Canada | Defeated (unconfirmed) |
| British Columbia | Victoria | Phipps, John Randal | People's Party of Canada | Defeated (unconfirmed) |
| British Columbia | Victoria | Reichert, Jordan Andrew | Animal Protection Party of Canada | Defeated (unconfirmed) |
| British Columbia | Victoria | Zroback, Janis | Communist Party of Canada | Defeated (unconfirmed) |
| British Columbia | West Vancouver—Sunshine Coast—Sea to Sky Country | Bebb, Robert Douglas | People's Party of Canada | Defeated (unconfirmed) |
| British Columbia | West Vancouver—Sunshine Coast—Sea to Sky Country | Grimwood, Terry | Independent | Defeated (unconfirmed) |
| British Columbia | West Vancouver—Sunshine Coast—Sea to Sky Country | Jeffrey, Gordon | Parti Rhinocéros Party | Defeated (unconfirmed) |
| British Columbia | West Vancouver—Sunshine Coast—Sea to Sky Country | Lewis, Avi | New Democratic Party | Defeated (unconfirmed) |
| British Columbia | West Vancouver—Sunshine Coast—Sea to Sky Country | MacGregor, Chris | Independent | Defeated (unconfirmed) |
| British Columbia | West Vancouver—Sunshine Coast—Sea to Sky Country | Simpson, Mike | Green Party of Canada | Defeated (unconfirmed) |
| British Columbia | West Vancouver—Sunshine Coast—Sea to Sky Country | Weiler, Patrick | Liberal Party of Canada | Re-Elected (unconfirmed) |
| British Columbia | West Vancouver—Sunshine Coast—Sea to Sky Country | Weston, John | Conservative Party of Canada | Defeated (unconfirmed) |
| Manitoba | Brandon—Souris | Baer, Tylor | People's Party of Canada | Defeated (unconfirmed) |
| Manitoba | Brandon—Souris | Branconnier, Linda | Liberal Party of Canada | Defeated (unconfirmed) |
| Manitoba | Brandon—Souris | Hodgins, Whitney | New Democratic Party | Defeated (unconfirmed) |
| Manitoba | Brandon—Souris | Maguire, Larry | Conservative Party of Canada | Re-Elected (unconfirmed) |
| Manitoba | Charleswood—St. James—Assiniboia—Headingley | Dwyer, Madelaine | New Democratic Party | Defeated (unconfirmed) |
| Manitoba | Charleswood—St. James—Assiniboia—Headingley | Eyolfson, Doug | Liberal Party of Canada | Defeated (unconfirmed) |
| Manitoba | Charleswood—St. James—Assiniboia—Headingley | Morantz, Marty | Conservative Party of Canada | Re-Elected (unconfirmed) |
| Manitoba | Charleswood—St. James—Assiniboia—Headingley | Parks, Vanessa | Green Party of Canada | Defeated (unconfirmed) |
| Manitoba | Charleswood—St. James—Assiniboia—Headingley | Van Hussen, Angela | People's Party of Canada | Defeated (unconfirmed) |
| Manitoba | Churchill—Keewatinook Aski | Ashton, Niki | New Democratic Party | Re-Elected (unconfirmed) |
| Manitoba | Churchill—Keewatinook Aski | Larocque, Charlotte | Conservative Party of Canada | Defeated (unconfirmed) |
| Manitoba | Churchill—Keewatinook Aski | McLean, Ralph | Green Party of Canada | Defeated (unconfirmed) |
| Manitoba | Churchill—Keewatinook Aski | Robinson, Shirley | Liberal Party of Canada | Defeated (unconfirmed) |
| Manitoba | Churchill—Keewatinook Aski | Young, Keith | People's Party of Canada | Defeated (unconfirmed) |
| Manitoba | Dauphin—Swan River—Neepawa | Carlson, Kevin | Liberal Party of Canada | Defeated (unconfirmed) |
| Manitoba | Dauphin—Swan River—Neepawa | Falloon-Austin, Lori | Maverick Party | Defeated (unconfirmed) |
| Manitoba | Dauphin—Swan River—Neepawa | Holroyd, Arthur | New Democratic Party | Defeated (unconfirmed) |
| Manitoba | Dauphin—Swan River—Neepawa | Lambrecht, Shirley | Green Party of Canada | Defeated (unconfirmed) |
| Manitoba | Dauphin—Swan River—Neepawa | Mazier, Dan | Conservative Party of Canada | Re-Elected (unconfirmed) |
| Manitoba | Dauphin—Swan River—Neepawa | McKenna, Donnan | People's Party of Canada | Defeated (unconfirmed) |
| Manitoba | Elmwood—Transcona | Blaikie, Daniel | New Democratic Party | Re-Elected (unconfirmed) |
| Manitoba | Elmwood—Transcona | Caron, Rejeanne | Conservative Party of Canada | Defeated (unconfirmed) |
| Manitoba | Elmwood—Transcona | Cumming, Jamie | People's Party of Canada | Defeated (unconfirmed) |
| Manitoba | Elmwood—Transcona | Hinchey, Devlin | Green Party of Canada | Defeated (unconfirmed) |
| Manitoba | Elmwood—Transcona | Mirwaldt, Sara | Liberal Party of Canada | Defeated (unconfirmed) |
| Manitoba | Kildonan—St. Paul | Bennett, Mary-Jane | Liberal Party of Canada | Defeated (unconfirmed) |
| Manitoba | Kildonan—St. Paul | Clark, Emily | New Democratic Party | Defeated (unconfirmed) |
| Manitoba | Kildonan—St. Paul | Dancho, Raquel | Conservative Party of Canada | Re-Elected (unconfirmed) |
| Manitoba | Kildonan—St. Paul | Howe, Sean | People's Party of Canada | Defeated (unconfirmed) |
| Manitoba | Portage—Lisgar | Bergen, Hon. Candice | Conservative Party of Canada | Re-Elected (unconfirmed) |
| Manitoba | Portage—Lisgar | Carrier, Andrew | Liberal Party of Canada | Defeated (unconfirmed) |
| Manitoba | Portage—Lisgar | Dondo, Jerome | Christian Heritage Party of Canada | Defeated (unconfirmed) |
| Manitoba | Portage—Lisgar | Friesen, Kenneth | New Democratic Party | Defeated (unconfirmed) |
| Manitoba | Portage—Lisgar | Wiebe, Solomon | People's Party of Canada | Defeated (unconfirmed) |
| Manitoba | Provencher | Falk, Ted | Conservative Party of Canada | Re-Elected (unconfirmed) |
| Manitoba | Provencher | Gautron, Noel | People's Party of Canada | Defeated (unconfirmed) |
| Manitoba | Provencher | Gibson, Janine | Green Party of Canada | Defeated (unconfirmed) |
| Manitoba | Provencher | Kirczenow, Trevor | Liberal Party of Canada | Defeated (unconfirmed) |
| Manitoba | Provencher | Loewen, Richard | Independent | Defeated (unconfirmed) |
| Manitoba | Provencher | Pottinger, Serina | New Democratic Party | Defeated (unconfirmed) |
| Manitoba | Saint Boniface—Saint Vital | Agboola, Shola | Conservative Party of Canada | Defeated (unconfirmed) |
| Manitoba | Saint Boniface—Saint Vital | Anderson, Scott A | Independent | Defeated (unconfirmed) |
| Manitoba | Saint Boniface—Saint Vital | Berthiaume, Denis | Independent | Defeated (unconfirmed) |
| Manitoba | Saint Boniface—Saint Vital | Boudreault, Jean-Denis | Independent | Defeated (unconfirmed) |
| Manitoba | Saint Boniface—Saint Vital | Coriveau, Sébastien | Parti Rhinocéros Party | Defeated (unconfirmed) |
| Manitoba | Saint Boniface—Saint Vital | Correia, Matthew | Veterans Coalition Party of Canada | Defeated (unconfirmed) |
| Manitoba | Saint Boniface—Saint Vital | Crisostomo, Naomi | Independent | Defeated (unconfirmed) |
| Manitoba | Saint Boniface—Saint Vital | Currie, Charles | Independent | Defeated (unconfirmed) |
| Manitoba | Saint Boniface—Saint Vital | Desbiens, Manon | Independent | Defeated (unconfirmed) |
| Manitoba | Saint Boniface—Saint Vital | Engering, Alexandra | Independent | Defeated (unconfirmed) |
| Manitoba | Saint Boniface—Saint Vital | Falkingham, Scott | Independent | Defeated (unconfirmed) |
| Manitoba | Saint Boniface—Saint Vital | Hildebrandt, Kerri | Independent | Defeated (unconfirmed) |
| Manitoba | Saint Boniface—Saint Vital | Huard, Ryan | Independent | Defeated (unconfirmed) |
| Manitoba | Saint Boniface—Saint Vital | Lukawski, Conrad | Independent | Defeated (unconfirmed) |
| Manitoba | Saint Boniface—Saint Vital | MacDiarmid, Jane | People's Party of Canada | Defeated (unconfirmed) |
| Manitoba | Saint Boniface—Saint Vital | Poliquin, Laurent | Green Party of Canada | Defeated (unconfirmed) |
| Manitoba | Saint Boniface—Saint Vital | Rosenblum, Eliana | Independent | Defeated (unconfirmed) |
| Manitoba | Saint Boniface—Saint Vital | Strzalkowski, Patrick | Independent | Defeated (unconfirmed) |
| Manitoba | Saint Boniface—Saint Vital | Szuchewycz, Tomas | Independent | Defeated (unconfirmed) |
| Manitoba | Saint Boniface—Saint Vital | Vandal, Hon. Dan | Liberal Party of Canada | Re-Elected (unconfirmed) |
| Manitoba | Saint Boniface—Saint Vital | Waters, Meghan | New Democratic Party | Defeated (unconfirmed) |
| Manitoba | Selkirk—Interlake—Eastman | Bezan, James | Conservative Party of Canada | Re-Elected (unconfirmed) |
| Manitoba | Selkirk—Interlake—Eastman | James, Wayne | Green Party of Canada | Defeated (unconfirmed) |
| Manitoba | Selkirk—Interlake—Eastman | Kathwaroon, Ian | People's Party of Canada | Defeated (unconfirmed) |
| Manitoba | Selkirk—Interlake—Eastman | Regelsky, Detlev | Liberal Party of Canada | Defeated (unconfirmed) |
| Manitoba | Selkirk—Interlake—Eastman | Smith, Margaret | New Democratic Party | Defeated (unconfirmed) |
| Manitoba | Winnipeg Centre | Bhakoo, Bhavni | People's Party of Canada | Defeated (unconfirmed) |
| Manitoba | Winnipeg Centre | Brenot, Sabrina | Conservative Party of Canada | Defeated (unconfirmed) |
| Manitoba | Winnipeg Centre | Brown, Andrew | Green Party of Canada | Defeated (unconfirmed) |
| Manitoba | Winnipeg Centre | Buhler, James | Libertarian Party of Canada | Defeated (unconfirmed) |
| Manitoba | Winnipeg Centre | Gazan, Leah | New Democratic Party | Re-Elected (unconfirmed) |
| Manitoba | Winnipeg Centre | Ong, Paul | Liberal Party of Canada | Defeated (unconfirmed) |
| Manitoba | Winnipeg Centre | Wall, Debra | Animal Protection Party of Canada | Defeated (unconfirmed) |
| Manitoba | Winnipeg North | Brydges, Angela | Green Party of Canada | Defeated (unconfirmed) |
| Manitoba | Winnipeg North | Chung, Melissa | New Democratic Party | Defeated (unconfirmed) |
| Manitoba | Winnipeg North | Crooks, Robert | Communist Party of Canada | Defeated (unconfirmed) |
| Manitoba | Winnipeg North | Kassem, Anas | Conservative Party of Canada | Defeated (unconfirmed) |
| Manitoba | Winnipeg North | Lamoureux, Kevin | Liberal Party of Canada | Re-Elected (unconfirmed) |
| Manitoba | Winnipeg North | Neilan, Patrick John Xenon | People's Party of Canada | Defeated (unconfirmed) |
| Manitoba | Winnipeg South | Boettcher, Gregory | Green Party of Canada | Defeated (unconfirmed) |
| Manitoba | Winnipeg South | Duguid, Terry | Liberal Party of Canada | Re-Elected (unconfirmed) |
| Manitoba | Winnipeg South | Gryba, Byron Curtis | People's Party of Canada | Defeated (unconfirmed) |
| Manitoba | Winnipeg South | Kahanovitch, Aiden | New Democratic Party | Defeated (unconfirmed) |
| Manitoba | Winnipeg South | Maher, Melanie | Conservative Party of Canada | Defeated (unconfirmed) |
| Manitoba | Winnipeg South Centre | Bateman, Joyce | Conservative Party of Canada | Defeated (unconfirmed) |
| Manitoba | Winnipeg South Centre | Carr, Hon. Jim | Liberal Party of Canada | Re-Elected (unconfirmed) |
| Manitoba | Winnipeg South Centre | Hemmerling, Douglas | Green Party of Canada | Defeated (unconfirmed) |
| Manitoba | Winnipeg South Centre | Popham, Cameron Scott | Communist Party of Canada | Defeated (unconfirmed) |
| Manitoba | Winnipeg South Centre | Riddell, Julia | New Democratic Party | Defeated (unconfirmed) |
| Manitoba | Winnipeg South Centre | Wells, Chase | People's Party of Canada | Defeated (unconfirmed) |
| New Brunswick | Acadie—Bathurst | Cormier, Serge | Liberal Party of Canada | Re-Elected (unconfirmed) |
| New Brunswick | Acadie—Bathurst | Doiron, Richer | Free Party Canada | Defeated (unconfirmed) |
| New Brunswick | Acadie—Bathurst | Hébert, Mélissa | New Democratic Party | Defeated (unconfirmed) |
| New Brunswick | Acadie—Bathurst | Johns, Rachel | Green Party of Canada | Defeated (unconfirmed) |
| New Brunswick | Acadie—Bathurst | Langford, Kenneth | People's Party of Canada | Defeated (unconfirmed) |
| New Brunswick | Acadie—Bathurst | Lanteigne, Jean-Paul | Conservative Party of Canada | Defeated (unconfirmed) |
| New Brunswick | Beauséjour | Girouard, Stella Anna | Green Party of Canada | Defeated (unconfirmed) |
| New Brunswick | Beauséjour | Godfrey, Evelyne | New Democratic Party | Defeated (unconfirmed) |
| New Brunswick | Beauséjour | LeBlanc, Hon. Dominic | Liberal Party of Canada | Re-Elected (unconfirmed) |
| New Brunswick | Beauséjour | Minor, Jack | People's Party of Canada | Defeated (unconfirmed) |
| New Brunswick | Beauséjour | Mitchell, Shelly | Conservative Party of Canada | Defeated (unconfirmed) |
| New Brunswick | Beauséjour | Sauriol Chiasson, Isabelle | Free Party Canada | Defeated (unconfirmed) |
| New Brunswick | Fredericton | Atwin, Jenica | Liberal Party of Canada | Re-Elected (unconfirmed) |
| New Brunswick | Fredericton | Johnson, Andrea | Conservative Party of Canada | Defeated (unconfirmed) |
| New Brunswick | Fredericton | Kirby, Brandon | Libertarian Party of Canada | Defeated (unconfirmed) |
| New Brunswick | Fredericton | O'Byrne, Nicole | Green Party of Canada | Defeated (unconfirmed) |
| New Brunswick | Fredericton | Oldenburg, Shawn | New Democratic Party | Defeated (unconfirmed) |
| New Brunswick | Fredericton | Patterson, Jacob | Communist Party of Canada | Defeated (unconfirmed) |
| New Brunswick | Fredericton | Smith, Jennifer | Independent | Defeated (unconfirmed) |
| New Brunswick | Fundy Royal | Dykeman, Whitney | Liberal Party of Canada | Defeated (unconfirmed) |
| New Brunswick | Fundy Royal | Floyd, Josh | New Democratic Party | Defeated (unconfirmed) |
| New Brunswick | Fundy Royal | Moore, Hon. Rob | Conservative Party of Canada | Re-Elected (unconfirmed) |
| New Brunswick | Fundy Royal | Thompson, Timothy | Green Party of Canada | Defeated (unconfirmed) |
| New Brunswick | Fundy Royal | Wheeler, Wayne | People's Party of Canada | Defeated (unconfirmed) |
| New Brunswick | Madawaska—Restigouche | Arseneault, René | Liberal Party of Canada | Re-Elected (unconfirmed) |
| New Brunswick | Madawaska—Restigouche | Beaulieu, Shawn | Conservative Party of Canada | Defeated (unconfirmed) |
| New Brunswick | Madawaska—Restigouche | Bérubé, Louis | Free Party Canada | Defeated (unconfirmed) |
| New Brunswick | Madawaska—Restigouche | Blaevoet, Rebecca | Green Party of Canada | Defeated (unconfirmed) |
| New Brunswick | Madawaska—Restigouche | MacDonald, Elizabeth | New Democratic Party | Defeated (unconfirmed) |
| New Brunswick | Madawaska—Restigouche | Mercier, Nancy | People's Party of Canada | Defeated (unconfirmed) |
| New Brunswick | Miramichi—Grand Lake | Deitch, Patricia | Green Party of Canada | Defeated (unconfirmed) |
| New Brunswick | Miramichi—Grand Lake | Harris, Lisa | Liberal Party of Canada | Defeated (unconfirmed) |
| New Brunswick | Miramichi—Grand Lake | Nowlan, Joseph | People's Party of Canada | Defeated (unconfirmed) |
| New Brunswick | Miramichi—Grand Lake | Potter, Bruce | New Democratic Party | Defeated (unconfirmed) |
| New Brunswick | Miramichi—Grand Lake | Stewart, Jake | Conservative Party of Canada | Elected (unconfirmed) |
| New Brunswick | Moncton—Riverview—Dieppe | Carrier, Lorilee | People's Party of Canada | Defeated (unconfirmed) |
| New Brunswick | Moncton—Riverview—Dieppe | Dunn, Richard | Green Party of Canada | Defeated (unconfirmed) |
| New Brunswick | Moncton—Riverview—Dieppe | Landry, Serge | New Democratic Party | Defeated (unconfirmed) |
| New Brunswick | Moncton—Riverview—Dieppe | Petitpas Taylor, Hon. Ginette | Liberal Party of Canada | Re-Elected (unconfirmed) |
| New Brunswick | Moncton—Riverview—Dieppe | Smith, Darlene | Conservative Party of Canada | Defeated (unconfirmed) |
| New Brunswick | New Brunswick Southwest | Hickey, Jason | Liberal Party of Canada | Defeated (unconfirmed) |
| New Brunswick | New Brunswick Southwest | Reist, John | Green Party of Canada | Defeated (unconfirmed) |
| New Brunswick | New Brunswick Southwest | Sarty, Meryl | People's Party of Canada | Defeated (unconfirmed) |
| New Brunswick | New Brunswick Southwest | Warren, Richard | New Democratic Party | Defeated (unconfirmed) |
| New Brunswick | New Brunswick Southwest | Williamson, John | Conservative Party of Canada | Re-Elected (unconfirmed) |
| New Brunswick | Saint John—Rothesay | Durant Paulin, Donald | New Democratic Party | Defeated (unconfirmed) |
| New Brunswick | Saint John—Rothesay | Long, Wayne | Liberal Party of Canada | Re-Elected (unconfirmed) |
| New Brunswick | Saint John—Rothesay | McAllister, Ann | Green Party of Canada | Defeated (unconfirmed) |
| New Brunswick | Saint John—Rothesay | Norton, Mel | Conservative Party of Canada | Defeated (unconfirmed) |
| New Brunswick | Saint John—Rothesay | Pereira, Nicholas | People's Party of Canada | Defeated (unconfirmed) |
| New Brunswick | Tobique—Mactaquac | Bragdon, Richard | Conservative Party of Canada | Re-Elected (unconfirmed) |
| New Brunswick | Tobique—Mactaquac | LaForest, Steven | Independent | Defeated (unconfirmed) |
| New Brunswick | Tobique—Mactaquac | Martin, Anthony | Green Party of Canada | Defeated (unconfirmed) |
| New Brunswick | Tobique—Mactaquac | Miller, Meriet | New Democratic Party | Defeated (unconfirmed) |
| New Brunswick | Tobique—Mactaquac | Robinson, Cully | Liberal Party of Canada | Defeated (unconfirmed) |
| New Brunswick | Tobique—Mactaquac | Waggoner, Daniel | People's Party of Canada | Defeated (unconfirmed) |
| Newfoundland and Labrador | Avalon | Chapman, Matthew | Conservative Party of Canada | Defeated (unconfirmed) |
| Newfoundland and Labrador | Avalon | Davis, Carolyn | New Democratic Party | Defeated (unconfirmed) |
| Newfoundland and Labrador | Avalon | McDonald, Ken | Liberal Party of Canada | Re-Elected (unconfirmed) |
| Newfoundland and Labrador | Avalon | Stewart-Rideout, Magdalena | People's Party of Canada | Defeated (unconfirmed) |
| Newfoundland and Labrador | Bonavista—Burin—Trinity | Anonsen, Anne Marie | New Democratic Party | Defeated (unconfirmed) |
| Newfoundland and Labrador | Bonavista—Burin—Trinity | Hogan, Linda | People's Party of Canada | Defeated (unconfirmed) |
| Newfoundland and Labrador | Bonavista—Burin—Trinity | Rogers, Churence | Liberal Party of Canada | Re-Elected (unconfirmed) |
| Newfoundland and Labrador | Bonavista—Burin—Trinity | Vokey, Sharon | Conservative Party of Canada | Defeated (unconfirmed) |
| Newfoundland and Labrador | Coast of Bays—Central—Notre Dame | Ruby, Jamie | New Democratic Party | Defeated (unconfirmed) |
| Newfoundland and Labrador | Coast of Bays—Central—Notre Dame | Simms, Scott | Liberal Party of Canada | Defeated (unconfirmed) |
| Newfoundland and Labrador | Coast of Bays—Central—Notre Dame | Small, Clifford | Conservative Party of Canada | Elected (unconfirmed) |
| Newfoundland and Labrador | Labrador | Champion, Shannon | People's Party of Canada | Defeated (unconfirmed) |
| Newfoundland and Labrador | Labrador | Dumaresque, Shane | Conservative Party of Canada | Defeated (unconfirmed) |
| Newfoundland and Labrador | Labrador | Jones, Yvonne | Liberal Party of Canada | Re-Elected (unconfirmed) |
| Newfoundland and Labrador | Labrador | Norman, Amy | New Democratic Party | Defeated (unconfirmed) |
| Newfoundland and Labrador | Long Range Mountains | Anstey, Carol | Conservative Party of Canada | Defeated (unconfirmed) |
| Newfoundland and Labrador | Long Range Mountains | Hutchings, Gudie | Liberal Party of Canada | Re-Elected (unconfirmed) |
| Newfoundland and Labrador | Long Range Mountains | Mintz, Kaila | New Democratic Party | Defeated (unconfirmed) |
| Newfoundland and Labrador | Long Range Mountains | Shelley, Darrell | People's Party of Canada | Defeated (unconfirmed) |
| Newfoundland and Labrador | St. John's East | Etchegary, Glenn | Conservative Party of Canada | Defeated (unconfirmed) |
| Newfoundland and Labrador | St. John's East | Metcalfe, Dana | People's Party of Canada | Defeated (unconfirmed) |
| Newfoundland and Labrador | St. John's East | Shortall, Mary | New Democratic Party | Defeated (unconfirmed) |
| Newfoundland and Labrador | St. John's East | Thompson, Joanne | Liberal Party of Canada | Elected (unconfirmed) |
| Newfoundland and Labrador | St. John's South—Mount Pearl | Critch, Raymond | New Democratic Party | Defeated (unconfirmed) |
| Newfoundland and Labrador | St. John's South—Mount Pearl | Hodder, Steve | Conservative Party of Canada | Defeated (unconfirmed) |
| Newfoundland and Labrador | St. John's South—Mount Pearl | O'Regan, Hon. Seamus | Liberal Party of Canada | Re-Elected (unconfirmed) |
| Newfoundland and Labrador | St. John's South—Mount Pearl | Stewart, Georgia | People's Party of Canada | Defeated (unconfirmed) |
| Northwest Territories | Northwest Territories | Groenewegen, Jane | Independent | Defeated (unconfirmed) |
| Northwest Territories | Northwest Territories | Kotchilea, Kelvin | New Democratic Party | Defeated (unconfirmed) |
| Northwest Territories | Northwest Territories | Laufer, Roland | Green Party of Canada | Defeated (unconfirmed) |
| Northwest Territories | Northwest Territories | McLeod, Michael V. | Liberal Party of Canada | Re-Elected (unconfirmed) |
| Northwest Territories | Northwest Territories | Mollison, Lea | Conservative Party of Canada | Defeated (unconfirmed) |
| Nova Scotia | Cape Breton—Canso | Grandy, Brad | People's Party of Canada | Defeated (unconfirmed) |
| Nova Scotia | Cape Breton—Canso | Kelloway, Mike | Liberal Party of Canada | Re-Elected (unconfirmed) |
| Nova Scotia | Cape Breton—Canso | MacLeod, Fiona | Conservative Party of Canada | Defeated (unconfirmed) |
| Nova Scotia | Cape Breton—Canso | Reddick, Jana | New Democratic Party | Defeated (unconfirmed) |
| Nova Scotia | Central Nova | Cotter, John Steven | Conservative Party of Canada | Defeated (unconfirmed) |
| Nova Scotia | Central Nova | Fraser, Sean | Liberal Party of Canada | Re-Elected (unconfirmed) |
| Nova Scotia | Central Nova | Frazer, Christopher | Communist Party of Canada | Defeated (unconfirmed) |
| Nova Scotia | Central Nova | Henderson, Harvey | Independent | Defeated (unconfirmed) |
| Nova Scotia | Central Nova | MacDonald, Teresa | New Democratic Party | Defeated (unconfirmed) |
| Nova Scotia | Central Nova | Muir, James | People's Party of Canada | Defeated (unconfirmed) |
| Nova Scotia | Central Nova | Nikas, Katerina | Green Party of Canada | Defeated (unconfirmed) |
| Nova Scotia | Central Nova | Smyth, Jeffrey | Parti Rhinocéros Party | Defeated (unconfirmed) |
| Nova Scotia | Cumberland—Colchester | Archer, William | People's Party of Canada | Defeated (unconfirmed) |
| Nova Scotia | Cumberland—Colchester | Ellis, Stephen | Conservative Party of Canada | Elected (unconfirmed) |
| Nova Scotia | Cumberland—Colchester | Foster, Jillian | Green Party of Canada | Defeated (unconfirmed) |
| Nova Scotia | Cumberland—Colchester | O'Blenis, Jody | Independent | Defeated (unconfirmed) |
| Nova Scotia | Cumberland—Colchester | Osborne, Daniel | New Democratic Party | Defeated (unconfirmed) |
| Nova Scotia | Cumberland—Colchester | Zann, Lenore | Liberal Party of Canada | Defeated (unconfirmed) |
| Nova Scotia | Dartmouth—Cole Harbour | Fisher, Darren | Liberal Party of Canada | Re-Elected (unconfirmed) |
| Nova Scotia | Dartmouth—Cole Harbour | Lindsay, Michelle | People's Party of Canada | Defeated (unconfirmed) |
| Nova Scotia | Dartmouth—Cole Harbour | Payne, Kevin | New Democratic Party | Defeated (unconfirmed) |
| Nova Scotia | Dartmouth—Cole Harbour | Zaman, Rana | Green Party of Canada | Defeated (unconfirmed) |
| Nova Scotia | Halifax | Campbell, Katie | Communist Party of Canada | Defeated (unconfirmed) |
| Nova Scotia | Halifax | Ells, Cameron | Conservative Party of Canada | Defeated (unconfirmed) |
| Nova Scotia | Halifax | Fillmore, Andy | Liberal Party of Canada | Re-Elected (unconfirmed) |
| Nova Scotia | Halifax | Hébert, B. Alexander | People's Party of Canada | Defeated (unconfirmed) |
| Nova Scotia | Halifax | Roberts, Jo-Ann | Green Party of Canada | Defeated (unconfirmed) |
| Nova Scotia | Halifax | Roberts, Lisa | New Democratic Party | Defeated (unconfirmed) |
| Nova Scotia | Halifax West | Diab, Lena Metlege | Liberal Party of Canada | Elected (unconfirmed) |
| Nova Scotia | Halifax West | Humphries, Eleanor | Conservative Party of Canada | Defeated (unconfirmed) |
| Nova Scotia | Halifax West | Roberts, Jonathan | New Democratic Party | Defeated (unconfirmed) |
| Nova Scotia | Halifax West | Schulthies, Kevin | Christian Heritage Party of Canada | Defeated (unconfirmed) |
| Nova Scotia | Halifax West | Scott, Julie | People's Party of Canada | Defeated (unconfirmed) |
| Nova Scotia | Halifax West | Zurawski, Richard Henryk | Green Party of Canada | Defeated (unconfirmed) |
| Nova Scotia | Kings—Hants | Blois, Kody | Liberal Party of Canada | Re-Elected (unconfirmed) |
| Nova Scotia | Kings—Hants | Ford, Steven | People's Party of Canada | Defeated (unconfirmed) |
| Nova Scotia | Kings—Hants | Parent, Mark | Conservative Party of Canada | Defeated (unconfirmed) |
| Nova Scotia | Kings—Hants | Richardson, Sheila | Green Party of Canada | Defeated (unconfirmed) |
| Nova Scotia | Kings—Hants | Schneider, Stephen | New Democratic Party | Defeated (unconfirmed) |
| Nova Scotia | Sackville—Preston—Chezzetcook | Chisholm, Jenna | New Democratic Party | Defeated (unconfirmed) |
| Nova Scotia | Sackville—Preston—Chezzetcook | Conrad, Angela | Conservative Party of Canada | Defeated (unconfirmed) |
| Nova Scotia | Sackville—Preston—Chezzetcook | Edmonds, Anthony | Green Party of Canada | Defeated (unconfirmed) |
| Nova Scotia | Sackville—Preston—Chezzetcook | Gosse, Earl | People's Party of Canada | Defeated (unconfirmed) |
| Nova Scotia | Sackville—Preston—Chezzetcook | Samson, Darrell | Liberal Party of Canada | Re-Elected (unconfirmed) |
| Nova Scotia | South Shore—St. Margarets | Dorey, Olivia | New Democratic Party | Defeated (unconfirmed) |
| Nova Scotia | South Shore—St. Margarets | Jordan, Hon. Bernadette | Liberal Party of Canada | Defeated (unconfirmed) |
| Nova Scotia | South Shore—St. Margarets | Perkins, Richard | Conservative Party of Canada | Elected (unconfirmed) |
| Nova Scotia | South Shore—St. Margarets | Trappenberg, Thomas | Green Party of Canada | Defeated (unconfirmed) |
| Nova Scotia | Sydney—Victoria | Barron, Ronald Angus | People's Party of Canada | Defeated (unconfirmed) |
| Nova Scotia | Sydney—Victoria | Battiste, Jaime | Liberal Party of Canada | Re-Elected (unconfirmed) |
| Nova Scotia | Sydney—Victoria | Boisvert, Ashley | Marxist-Leninist Party of Canada | Defeated (unconfirmed) |
| Nova Scotia | Sydney—Victoria | Embrett, Mark | Green Party of Canada | Defeated (unconfirmed) |
| Nova Scotia | Sydney—Victoria | Orrell, Ralph Edward | Conservative Party of Canada | Defeated (unconfirmed) |
| Nova Scotia | Sydney—Victoria | Ward, Jeffery | New Democratic Party | Defeated (unconfirmed) |
| Nova Scotia | West Nova | Burbidge, Cheryl | New Democratic Party | Defeated (unconfirmed) |
| Nova Scotia | West Nova | Chamberlain, Alxys | Liberal Party of Canada | Defeated (unconfirmed) |
| Nova Scotia | West Nova | d'Entremont, Chris | Conservative Party of Canada | Re-Elected (unconfirmed) |
| Nova Scotia | West Nova | Spidle, Scott | People's Party of Canada | Defeated (unconfirmed) |
| Nunavut | Nunavut | Angnakak, Patricia Jane | Liberal Party of Canada | Defeated (unconfirmed) |
| Nunavut | Nunavut | Idlout, Lori | New Democratic Party | Elected (unconfirmed) |
| Nunavut | Nunavut | Mackenzie, Laura | Conservative Party of Canada | Defeated (unconfirmed) |
| Ontario | Ajax | Awan, Mohammad | Conservative Party of Canada | Defeated (unconfirmed) |
| Ontario | Ajax | Holland, Hon. Mark | Liberal Party of Canada | Re-Elected (unconfirmed) |
| Ontario | Ajax | Hughes, Monique | New Democratic Party | Defeated (unconfirmed) |
| Ontario | Ajax | Paulseth, Leigh | Green Party of Canada | Defeated (unconfirmed) |
| Ontario | Algoma—Manitoulin—Kapuskasing | Baarda, Clarence | Christian Heritage Party of Canada | Defeated (unconfirmed) |
| Ontario | Algoma—Manitoulin—Kapuskasing | Hughes, Carol | New Democratic Party | Re-Elected (unconfirmed) |
| Ontario | Algoma—Manitoulin—Kapuskasing | Jaaskelainen, Harry | People's Party of Canada | Defeated (unconfirmed) |
| Ontario | Algoma—Manitoulin—Kapuskasing | Peltier, Norman James Duke | Liberal Party of Canada | Defeated (unconfirmed) |
| Ontario | Algoma—Manitoulin—Kapuskasing | Sagman, John | Conservative Party of Canada | Defeated (unconfirmed) |
| Ontario | Algoma—Manitoulin—Kapuskasing | Zimmermann, Stephen | Green Party of Canada | Defeated (unconfirmed) |
| Ontario | Aurora—Oak Ridges—Richmond Hill | Alleslev, Leona | Conservative Party of Canada | Defeated (unconfirmed) |
| Ontario | Aurora—Oak Ridges—Richmond Hill | Hagan, Janice | New Democratic Party | Defeated (unconfirmed) |
| Ontario | Aurora—Oak Ridges—Richmond Hill | Korovitsyn, Serge | Libertarian Party of Canada | Defeated (unconfirmed) |
| Ontario | Aurora—Oak Ridges—Richmond Hill | Siskos, Anthony | People's Party of Canada | Defeated (unconfirmed) |
| Ontario | Aurora—Oak Ridges—Richmond Hill | Taylor Roy, Leah | Liberal Party of Canada | Elected (unconfirmed) |
| Ontario | Barrie—Innisfil | Brancato, Corrado | People's Party of Canada | Defeated (unconfirmed) |
| Ontario | Barrie—Innisfil | Brassard, John | Conservative Party of Canada | Re-Elected (unconfirmed) |
| Ontario | Barrie—Innisfil | Gostkowski, Aleesha | New Democratic Party | Defeated (unconfirmed) |
| Ontario | Barrie—Innisfil | Wilson, Lisa-Marie | Liberal Party of Canada | Defeated (unconfirmed) |
| Ontario | Barrie—Springwater—Oro-Medonte | Lochhead, Sarah | New Democratic Party | Defeated (unconfirmed) |
| Ontario | Barrie—Springwater—Oro-Medonte | Saari, Tanya | Liberal Party of Canada | Defeated (unconfirmed) |
| Ontario | Barrie—Springwater—Oro-Medonte | Shipley, Doug | Conservative Party of Canada | Re-Elected (unconfirmed) |
| Ontario | Barrie—Springwater—Oro-Medonte | Webb, Christopher | People's Party of Canada | Defeated (unconfirmed) |
| Ontario | Bay of Quinte | Bell, Stephanie | New Democratic Party | Defeated (unconfirmed) |
| Ontario | Bay of Quinte | Charlton, Erica | Green Party of Canada | Defeated (unconfirmed) |
| Ontario | Bay of Quinte | Ellis, Neil R. | Liberal Party of Canada | Defeated (unconfirmed) |
| Ontario | Bay of Quinte | LeClerc, Janine | People's Party of Canada | Defeated (unconfirmed) |
| Ontario | Bay of Quinte | Williams, Ryan | Conservative Party of Canada | Elected (unconfirmed) |
| Ontario | Beaches—East York | DeBoer, Reuben | Green Party of Canada | Defeated (unconfirmed) |
| Ontario | Beaches—East York | Erskine-Smith, Nathaniel | Liberal Party of Canada | Re-Elected (unconfirmed) |
| Ontario | Beaches—East York | Fernandez, Philip | Marxist-Leninist Party of Canada | Defeated (unconfirmed) |
| Ontario | Beaches—East York | Moxon, Jennifer | Communist Party of Canada | Defeated (unconfirmed) |
| Ontario | Beaches—East York | Rautescu, Radu | People's Party of Canada | Defeated (unconfirmed) |
| Ontario | Beaches—East York | Robinson, Lisa | Conservative Party of Canada | Defeated (unconfirmed) |
| Ontario | Beaches—East York | Ruiz Vargas, Alejandra | New Democratic Party | Defeated (unconfirmed) |
| Ontario | Beaches—East York | Wilde, Karen Lee | Independent | Defeated (unconfirmed) |
| Ontario | Brampton Centre | Ali, Shafqat | Liberal Party of Canada | Elected (unconfirmed) |
| Ontario | Brampton Centre | McDowell, James | New Democratic Party | Defeated (unconfirmed) |
| Ontario | Brampton Centre | Shino, Ronni | Independent | Defeated (unconfirmed) |
| Ontario | Brampton Centre | Singh, Jagdeep | Conservative Party of Canada | Defeated (unconfirmed) |
| Ontario | Brampton East | Bajaj, Navalkishore | Conservative Party of Canada | Defeated (unconfirmed) |
| Ontario | Brampton East | Bannister-Clarke, Gail | New Democratic Party | Defeated (unconfirmed) |
| Ontario | Brampton East | Matharoo, Manjeet | People's Party of Canada | Defeated (unconfirmed) |
| Ontario | Brampton East | Sidhu, Maninder | Liberal Party of Canada | Re-Elected (unconfirmed) |
| Ontario | Brampton North | Joshi, Medha | Conservative Party of Canada | Defeated (unconfirmed) |
| Ontario | Brampton North | Sahota, Ruby | Liberal Party of Canada | Re-Elected (unconfirmed) |
| Ontario | Brampton North | Yeh, Teresa | New Democratic Party | Defeated (unconfirmed) |
| Ontario | Brampton South | Brar, Ramandeep | Conservative Party of Canada | Defeated (unconfirmed) |
| Ontario | Brampton South | Craniotis, Nicholas | People's Party of Canada | Defeated (unconfirmed) |
| Ontario | Brampton South | Sidhu, Sonia | Liberal Party of Canada | Re-Elected (unconfirmed) |
| Ontario | Brampton South | Singh, Tejinder | New Democratic Party | Defeated (unconfirmed) |
| Ontario | Brampton West | Chambers, Jermaine | Conservative Party of Canada | Defeated (unconfirmed) |
| Ontario | Brampton West | Gill, Gurprit | New Democratic Party | Defeated (unconfirmed) |
| Ontario | Brampton West | Khera, Kamal | Liberal Party of Canada | Re-Elected (unconfirmed) |
| Ontario | Brampton West | Ramasamy, Sivakumar | Independent | Defeated (unconfirmed) |
| Ontario | Brampton West | Zia, Rahul Samuel | People's Party of Canada | Defeated (unconfirmed) |
| Ontario | Brantford—Brant | Bory, Leslie | Independent | Defeated (unconfirmed) |
| Ontario | Brantford—Brant | Brock, Larry | Conservative Party of Canada | Elected (unconfirmed) |
| Ontario | Brantford—Brant | Csordas, Karleigh | Green Party of Canada | Defeated (unconfirmed) |
| Ontario | Brantford—Brant | Macdonald, Alison | Liberal Party of Canada | Defeated (unconfirmed) |
| Ontario | Brantford—Brant | Roberts, Adrienne | New Democratic Party | Defeated (unconfirmed) |
| Ontario | Brantford—Brant | Squire, Dallas | People's Party of Canada | Defeated (unconfirmed) |
| Ontario | Brantford—Brant | Turmel, John C. | Independent | Defeated (unconfirmed) |
| Ontario | Bruce—Grey—Owen Sound | Fosbrooke, Anna-Marie | People's Party of Canada | Defeated (unconfirmed) |
| Ontario | Bruce—Grey—Owen Sound | Kaikkonen, Reima | Independent | Defeated (unconfirmed) |
| Ontario | Bruce—Grey—Owen Sound | Lawrence, Ashley | Green Party of Canada | Defeated (unconfirmed) |
| Ontario | Bruce—Grey—Owen Sound | Neudorf, Christopher | New Democratic Party | Defeated (unconfirmed) |
| Ontario | Bruce—Grey—Owen Sound | Ruff, Alex | Conservative Party of Canada | Re-Elected (unconfirmed) |
| Ontario | Bruce—Grey—Owen Sound | Watson, Anne Marie | Liberal Party of Canada | Defeated (unconfirmed) |
| Ontario | Burlington | Bator, Michael | People's Party of Canada | Defeated (unconfirmed) |
| Ontario | Burlington | Brown, Emily | Conservative Party of Canada | Defeated (unconfirmed) |
| Ontario | Burlington | Carroll, Jevin | Parti Rhinocéros Party | Defeated (unconfirmed) |
| Ontario | Burlington | Cullis, Christian | Green Party of Canada | Defeated (unconfirmed) |
| Ontario | Burlington | Gould, Hon. Karina | Liberal Party of Canada | Re-Elected (unconfirmed) |
| Ontario | Burlington | Page, Nick | New Democratic Party | Defeated (unconfirmed) |
| Ontario | Cambridge | Braniff, Michele | Green Party of Canada | Defeated (unconfirmed) |
| Ontario | Cambridge | Bruce, Lorne | New Democratic Party | Defeated (unconfirmed) |
| Ontario | Cambridge | Cody, Connie | Conservative Party of Canada | Defeated (unconfirmed) |
| Ontario | Cambridge | May, Bryan | Liberal Party of Canada | Re-Elected (unconfirmed) |
| Ontario | Cambridge | Segounis, Magdalene | People's Party of Canada | Defeated (unconfirmed) |
| Ontario | Carleton | Crawley, Peter | People's Party of Canada | Defeated (unconfirmed) |
| Ontario | Carleton | Dookeran, Nira | Green Party of Canada | Defeated (unconfirmed) |
| Ontario | Carleton | Hua, Kevin | New Democratic Party | Defeated (unconfirmed) |
| Ontario | Carleton | Poilievre, Hon. Pierre | Conservative Party of Canada | Re-Elected (unconfirmed) |
| Ontario | Carleton | Roy, Gustave | Liberal Party of Canada | Defeated (unconfirmed) |
| Ontario | Chatham-Kent—Leamington | Epp, Dave | Conservative Party of Canada | Re-Elected (unconfirmed) |
| Ontario | Chatham-Kent—Leamington | Gelinas, Daniel | New Democratic Party | Defeated (unconfirmed) |
| Ontario | Chatham-Kent—Leamington | Hetherington, Gregory | Liberal Party of Canada | Defeated (unconfirmed) |
| Ontario | Chatham-Kent—Leamington | Vallee, Elizabeth | People's Party of Canada | Defeated (unconfirmed) |
| Ontario | Chatham-Kent—Leamington | Vercouteren, Mark | Green Party of Canada | Defeated (unconfirmed) |
| Ontario | Davenport | Bravo, Alejandra | New Democratic Party | Defeated (unconfirmed) |
| Ontario | Davenport | Currie, Adrian | Green Party of Canada | Defeated (unconfirmed) |
| Ontario | Davenport | Dos Remedios, Tara | People's Party of Canada | Defeated (unconfirmed) |
| Ontario | Davenport | Dzerowicz, Julie | Liberal Party of Canada | Re-Elected (unconfirmed) |
| Ontario | Davenport | Kalevar, Chaitanya | Independent | Defeated (unconfirmed) |
| Ontario | Davenport | Kalimbet, Jenny | Conservative Party of Canada | Defeated (unconfirmed) |
| Ontario | Davenport | Young, Troy | Independent | Defeated (unconfirmed) |
| Ontario | Don Valley East | Coteau, Michael | Liberal Party of Canada | Elected (unconfirmed) |
| Ontario | Don Valley East | De Marco, Peter | People's Party of Canada | Defeated (unconfirmed) |
| Ontario | Don Valley East | Topp, Simon | New Democratic Party | Defeated (unconfirmed) |
| Ontario | Don Valley East | Williams, Penelope | Conservative Party of Canada | Defeated (unconfirmed) |
| Ontario | Don Valley North | Dong, Han | Liberal Party of Canada | Re-Elected (unconfirmed) |
| Ontario | Don Valley North | Griffin, Alan | New Democratic Party | Defeated (unconfirmed) |
| Ontario | Don Valley North | Sobel, Jay | People's Party of Canada | Defeated (unconfirmed) |
| Ontario | Don Valley North | Telfer, Natalie | Green Party of Canada | Defeated (unconfirmed) |
| Ontario | Don Valley North | Zuniga, Sabrina | Conservative Party of Canada | Defeated (unconfirmed) |
| Ontario | Don Valley West | Caputolan, Elvira | Green Party of Canada | Defeated (unconfirmed) |
| Ontario | Don Valley West | Khan, Adil | Centrist Party of Canada | Defeated (unconfirmed) |
| Ontario | Don Valley West | Minas, Michael | People's Party of Canada | Defeated (unconfirmed) |
| Ontario | Don Valley West | Oliphant, Robert | Liberal Party of Canada | Re-Elected (unconfirmed) |
| Ontario | Don Valley West | Riaz, Syeda | New Democratic Party | Defeated (unconfirmed) |
| Ontario | Don Valley West | Robertson, Yvonne | Conservative Party of Canada | Defeated (unconfirmed) |
| Ontario | Dufferin—Caledon | Le Forestier, Jenni | Green Party of Canada | Defeated (unconfirmed) |
| Ontario | Dufferin—Caledon | McKendrick, Stephen | Independent | Defeated (unconfirmed) |
| Ontario | Dufferin—Caledon | Post, Lisa | Liberal Party of Canada | Defeated (unconfirmed) |
| Ontario | Dufferin—Caledon | Sanchez, Samantha | New Democratic Party | Defeated (unconfirmed) |
| Ontario | Dufferin—Caledon | Seeback, Kyle | Conservative Party of Canada | Re-Elected (unconfirmed) |
| Ontario | Dufferin—Caledon | Zambito, Anthony | People's Party of Canada | Defeated (unconfirmed) |
| Ontario | Durham | Baron, Sarah Gabrielle | Independent | Defeated (unconfirmed) |
| Ontario | Durham | Cameron, Christopher | New Democratic Party | Defeated (unconfirmed) |
| Ontario | Durham | Conlin, Patricia | People's Party of Canada | Defeated (unconfirmed) |
| Ontario | Durham | Giancroce, Jonathan | Liberal Party of Canada | Defeated (unconfirmed) |
| Ontario | Durham | O'Toole, Hon. Erin | Conservative Party of Canada | Re-Elected (unconfirmed) |
| Ontario | Durham | Patch, Kurdil-Telt | Independent | Defeated (unconfirmed) |
| Ontario | Durham | Smith, Adam | Parti Rhinocéros Party | Defeated (unconfirmed) |
| Ontario | Eglinton—Lawrence | Frydman, Eric | Green Party of Canada | Defeated (unconfirmed) |
| Ontario | Eglinton—Lawrence | Gleeson, Timothy | People's Party of Canada | Defeated (unconfirmed) |
| Ontario | Eglinton—Lawrence | Mendicino, Hon. Marco | Liberal Party of Canada | Re-Elected (unconfirmed) |
| Ontario | Eglinton—Lawrence | Pollock, Geoffrey | Conservative Party of Canada | Defeated (unconfirmed) |
| Ontario | Eglinton—Lawrence | Senneker, Caleb | New Democratic Party | Defeated (unconfirmed) |
| Ontario | Elgin—Middlesex—London | Ajibowu, Afeez | Liberal Party of Canada | Defeated (unconfirmed) |
| Ontario | Elgin—Middlesex—London | Cody, Katelyn | New Democratic Party | Defeated (unconfirmed) |
| Ontario | Elgin—Middlesex—London | Hillier, Chelsea | People's Party of Canada | Defeated (unconfirmed) |
| Ontario | Elgin—Middlesex—London | Hopkins, Michael | Christian Heritage Party of Canada | Defeated (unconfirmed) |
| Ontario | Elgin—Middlesex—London | Stark, Amanda | Green Party of Canada | Defeated (unconfirmed) |
| Ontario | Elgin—Middlesex—London | Vecchio, Karen | Conservative Party of Canada | Re-Elected (unconfirmed) |
| Ontario | Essex | Charron-Rowberry, Beth | People's Party of Canada | Defeated (unconfirmed) |
| Ontario | Essex | Festeryga, Audrey | Liberal Party of Canada | Defeated (unconfirmed) |
| Ontario | Essex | George, Andrew | Independent | Defeated (unconfirmed) |
| Ontario | Essex | Lewis, Chris | Conservative Party of Canada | Re-Elected (unconfirmed) |
| Ontario | Essex | Palko, Jeremy | Christian Heritage Party of Canada | Defeated (unconfirmed) |
| Ontario | Essex | Pancheshan, Nancy | Green Party of Canada | Defeated (unconfirmed) |
| Ontario | Essex | Ramsey, Tracey | New Democratic Party | Defeated (unconfirmed) |
| Ontario | Etobicoke Centre | Baker, Yvan | Liberal Party of Canada | Re-Elected (unconfirmed) |
| Ontario | Etobicoke Centre | Cormier, Maurice | People's Party of Canada | Defeated (unconfirmed) |
| Ontario | Etobicoke Centre | Da silva, Ashley | New Democratic Party | Defeated (unconfirmed) |
| Ontario | Etobicoke Centre | Turner, Geoffrey | Conservative Party of Canada | Defeated (unconfirmed) |
| Ontario | Etobicoke—Lakeshore | Bains, Indira | Conservative Party of Canada | Defeated (unconfirmed) |
| Ontario | Etobicoke—Lakeshore | Carson, Sean | Parti Rhinocéros Party | Defeated (unconfirmed) |
| Ontario | Etobicoke—Lakeshore | Di Carlo, Anna | Marxist-Leninist Party of Canada | Defeated (unconfirmed) |
| Ontario | Etobicoke—Lakeshore | Elue, Afam | Green Party of Canada | Defeated (unconfirmed) |
| Ontario | Etobicoke—Lakeshore | Kane, Sasha | New Democratic Party | Defeated (unconfirmed) |
| Ontario | Etobicoke—Lakeshore | Maloney, James | Liberal Party of Canada | Re-Elected (unconfirmed) |
| Ontario | Etobicoke—Lakeshore | McLachlan, Bill | People's Party of Canada | Defeated (unconfirmed) |
| Ontario | Etobicoke North | Boutsikakis, Jim | People's Party of Canada | Defeated (unconfirmed) |
| Ontario | Etobicoke North | Duncan, Hon. Kirsty | Liberal Party of Canada | Re-Elected (unconfirmed) |
| Ontario | Etobicoke North | Lamba, Pritmohinder Kaur | Conservative Party of Canada | Defeated (unconfirmed) |
| Ontario | Etobicoke North | Peter, Cecil | New Democratic Party | Defeated (unconfirmed) |
| Ontario | Etobicoke North | Royer, Carol | Independent | Defeated (unconfirmed) |
| Ontario | Flamborough—Glanbrook | Hatch, Thomas | Green Party of Canada | Defeated (unconfirmed) |
| Ontario | Flamborough—Glanbrook | Muys, Dan | Conservative Party of Canada | Elected (unconfirmed) |
| Ontario | Flamborough—Glanbrook | Newick, Lorne | New Democratic Party | Defeated (unconfirmed) |
| Ontario | Flamborough—Glanbrook | Panchyshyn, Bill | People's Party of Canada | Defeated (unconfirmed) |
| Ontario | Flamborough—Glanbrook | Sgro, Vito | Liberal Party of Canada | Defeated (unconfirmed) |
| Ontario | Glengarry—Prescott—Russell | Austring, Brennan | People's Party of Canada | Defeated (unconfirmed) |
| Ontario | Glengarry—Prescott—Russell | Bisaillon, Marc | Free Party Canada | Defeated (unconfirmed) |
| Ontario | Glengarry—Prescott—Russell | Drouin, Francis | Liberal Party of Canada | Re-Elected (unconfirmed) |
| Ontario | Glengarry—Prescott—Russell | Lapierre, Daniel | Green Party of Canada | Defeated (unconfirmed) |
| Ontario | Glengarry—Prescott—Russell | Malakos, Konstantine | New Democratic Party | Defeated (unconfirmed) |
| Ontario | Glengarry—Prescott—Russell | McArthur, Susan | Conservative Party of Canada | Defeated (unconfirmed) |
| Ontario | Glengarry—Prescott—Russell | Moore, Tyler | Independent | Defeated (unconfirmed) |
| Ontario | Guelph | Bowman, Michelle | Green Party of Canada | Defeated (unconfirmed) |
| Ontario | Guelph | Dineen, Tristan | Communist Party of Canada | Defeated (unconfirmed) |
| Ontario | Guelph | Jahangir, Aisha | New Democratic Party | Defeated (unconfirmed) |
| Ontario | Guelph | Leier, Joshua | People's Party of Canada | Defeated (unconfirmed) |
| Ontario | Guelph | Levenson, Karen | Animal Protection Party of Canada | Defeated (unconfirmed) |
| Ontario | Guelph | Longfield, Lloyd | Liberal Party of Canada | Re-Elected (unconfirmed) |
| Ontario | Guelph | Sachan, Ashish | Conservative Party of Canada | Defeated (unconfirmed) |
| Ontario | Haldimand—Norfolk | Gilpin, Kenneth John | People's Party of Canada | Defeated (unconfirmed) |
| Ontario | Haldimand—Norfolk | Lewis, Leslyn | Conservative Party of Canada | Elected (unconfirmed) |
| Ontario | Haldimand—Norfolk | Lugosi, Charles | Christian Heritage Party of Canada | Defeated (unconfirmed) |
| Ontario | Haldimand—Norfolk | Matthews, Karen | Liberal Party of Canada | Defeated (unconfirmed) |
| Ontario | Haldimand—Norfolk | McMorrow, George | Veterans Coalition Party of Canada | Defeated (unconfirmed) |
| Ontario | Haldimand—Norfolk | Piironen, Meghan | New Democratic Party | Defeated (unconfirmed) |
| Ontario | Haliburton—Kawartha Lakes—Brock | Balfour, Eugene | Libertarian Party of Canada | Defeated (unconfirmed) |
| Ontario | Haliburton—Kawartha Lakes—Brock | Davidson, Alison | People's Party of Canada | Defeated (unconfirmed) |
| Ontario | Haliburton—Kawartha Lakes—Brock | Forbes, Judith | Liberal Party of Canada | Defeated (unconfirmed) |
| Ontario | Haliburton—Kawartha Lakes—Brock | Godsoe, Angel | Green Party of Canada | Defeated (unconfirmed) |
| Ontario | Haliburton—Kawartha Lakes—Brock | Miller, Zac | New Democratic Party | Defeated (unconfirmed) |
| Ontario | Haliburton—Kawartha Lakes—Brock | Schmale, Jamie | Conservative Party of Canada | Re-Elected (unconfirmed) |
| Ontario | Hamilton Centre | Barber, Kevin Samuel | People's Party of Canada | Defeated (unconfirmed) |
| Ontario | Hamilton Centre | Bennett, Margaret | Liberal Party of Canada | Defeated (unconfirmed) |
| Ontario | Hamilton Centre | Cheriyan, Nigel | Communist Party of Canada | Defeated (unconfirmed) |
| Ontario | Hamilton Centre | Green, Matthew | New Democratic Party | Re-Elected (unconfirmed) |
| Ontario | Hamilton Centre | Grenning, Fabian | Conservative Party of Canada | Defeated (unconfirmed) |
| Ontario | Hamilton Centre | Weinstein, Avra Caroline | Green Party of Canada | Defeated (unconfirmed) |
| Ontario | Hamilton Centre | Yan, Nathalie Xian Yi | Independent | Defeated (unconfirmed) |
| Ontario | Hamilton East—Stoney Creek | Collins, Chad | Liberal Party of Canada | Elected (unconfirmed) |
| Ontario | Hamilton East—Stoney Creek | Kuruc, Nenad | Conservative Party of Canada | Defeated (unconfirmed) |
| Ontario | Hamilton East—Stoney Creek | Milanovic, Nikola | New Democratic Party | Defeated (unconfirmed) |
| Ontario | Hamilton East—Stoney Creek | Pattison, Larry | Green Party of Canada | Defeated (unconfirmed) |
| Ontario | Hamilton East—Stoney Creek | Ricci, Mario | People's Party of Canada | Defeated (unconfirmed) |
| Ontario | Hamilton Mountain | Allen, Malcolm | New Democratic Party | Defeated (unconfirmed) |
| Ontario | Hamilton Mountain | Enos, James | Christian Heritage Party of Canada | Defeated (unconfirmed) |
| Ontario | Hamilton Mountain | Hepfner, Lisa | Liberal Party of Canada | Elected (unconfirmed) |
| Ontario | Hamilton Mountain | Miles, Allan | Conservative Party of Canada | Defeated (unconfirmed) |
| Ontario | Hamilton Mountain | Taylor, Chelsea | People's Party of Canada | Defeated (unconfirmed) |
| Ontario | Hamilton Mountain | Urquhart, David Allan | Green Party of Canada | Defeated (unconfirmed) |
| Ontario | Hamilton West—Ancaster—Dundas | Galea, Victoria | Green Party of Canada | Defeated (unconfirmed) |
| Ontario | Hamilton West—Ancaster—Dundas | Henriquez, Roberto | New Democratic Party | Defeated (unconfirmed) |
| Ontario | Hamilton West—Ancaster—Dundas | Laranjo, Humberto | Conservative Party of Canada | Defeated (unconfirmed) |
| Ontario | Hamilton West—Ancaster—Dundas | Rocchi, Spencer | Parti Rhinocéros Party | Defeated (unconfirmed) |
| Ontario | Hamilton West—Ancaster—Dundas | Tassi, Hon. Filomena | Liberal Party of Canada | Re-Elected (unconfirmed) |
| Ontario | Hamilton West—Ancaster—Dundas | Woods, Dean | People's Party of Canada | Defeated (unconfirmed) |
| Ontario | Hastings—Lennox and Addington | Babcock, James | People's Party of Canada | Defeated (unconfirmed) |
| Ontario | Hastings—Lennox and Addington | Bossio, Mike | Liberal Party of Canada | Defeated (unconfirmed) |
| Ontario | Hastings—Lennox and Addington | DeBues, Matilda | New Democratic Party | Defeated (unconfirmed) |
| Ontario | Hastings—Lennox and Addington | Kramp-Neuman, Shelby | Conservative Party of Canada | Elected (unconfirmed) |
| Ontario | Hastings—Lennox and Addington | Sloan, Jennifer | Independent | Defeated (unconfirmed) |
| Ontario | Hastings—Lennox and Addington | Wilson, James Reginald | Green Party of Canada | Defeated (unconfirmed) |
| Ontario | Humber River—Black Creek | Anderson, Raatib | People's Party of Canada | Defeated (unconfirmed) |
| Ontario | Humber River—Black Creek | de Dovitiis, Matias | New Democratic Party | Defeated (unconfirmed) |
| Ontario | Humber River—Black Creek | Nugent, Christine | Marxist-Leninist Party of Canada | Defeated (unconfirmed) |
| Ontario | Humber River—Black Creek | Sgro, Hon. Judy A. | Liberal Party of Canada | Re-Elected (unconfirmed) |
| Ontario | Humber River—Black Creek | Shah, Rinku | Conservative Party of Canada | Defeated (unconfirmed) |
| Ontario | Humber River—Black Creek | Tibbin, Unblind Kheper Keseb | Green Party of Canada | Defeated (unconfirmed) |
| Ontario | Huron—Bruce | Johnstone, Alexandria | New Democratic Party | Defeated (unconfirmed) |
| Ontario | Huron—Bruce | Lobb, Ben | Conservative Party of Canada | Re-Elected (unconfirmed) |
| Ontario | Huron—Bruce | Rice, James | Liberal Party of Canada | Defeated (unconfirmed) |
| Ontario | Huron—Bruce | Smith, Justin | Independent | Defeated (unconfirmed) |
| Ontario | Huron—Bruce | Stecho, Jack | People's Party of Canada | Defeated (unconfirmed) |
| Ontario | Kanata—Carleton | Coenraad, Melissa | New Democratic Party | Defeated (unconfirmed) |
| Ontario | Kanata—Carleton | McAndrew, Jennifer | Conservative Party of Canada | Defeated (unconfirmed) |
| Ontario | Kanata—Carleton | Miller, Scott | People's Party of Canada | Defeated (unconfirmed) |
| Ontario | Kanata—Carleton | Purdy, Jennifer | Green Party of Canada | Defeated (unconfirmed) |
| Ontario | Kanata—Carleton | Sudds, Jenna | Liberal Party of Canada | Elected (unconfirmed) |
| Ontario | Kenora | Bruno, David | Liberal Party of Canada | Defeated (unconfirmed) |
| Ontario | Kenora | Martin, Craig | People's Party of Canada | Defeated (unconfirmed) |
| Ontario | Kenora | Melillo, Eric | Conservative Party of Canada | Re-Elected (unconfirmed) |
| Ontario | Kenora | Rheault, Remi | Green Party of Canada | Defeated (unconfirmed) |
| Ontario | Kenora | Seymour, Janine | New Democratic Party | Defeated (unconfirmed) |
| Ontario | King—Vaughan | Herod, Roberta | Green Party of Canada | Defeated (unconfirmed) |
| Ontario | King—Vaughan | Lozano, Sandra | New Democratic Party | Defeated (unconfirmed) |
| Ontario | King—Vaughan | Oprisan, Gilmar | People's Party of Canada | Defeated (unconfirmed) |
| Ontario | King—Vaughan | Roberts, Anna | Conservative Party of Canada | Elected (unconfirmed) |
| Ontario | King—Vaughan | Schulte, Hon. Deb | Liberal Party of Canada | Defeated (unconfirmed) |
| Ontario | Kingston and the Islands | Gerretsen, Mark | Liberal Party of Canada | Re-Elected (unconfirmed) |
| Ontario | Kingston and the Islands | Khan, Wajahat | Green Party of Canada | Defeated (unconfirmed) |
| Ontario | Kingston and the Islands | Oosterhof, Gary | Conservative Party of Canada | Defeated (unconfirmed) |
| Ontario | Kingston and the Islands | Sahai, Vivekanand | New Democratic Party | Defeated (unconfirmed) |
| Ontario | Kingston and the Islands | Sayle-Udall, Shelley | People's Party of Canada | Defeated (unconfirmed) |
| Ontario | Kitchener Centre | Boskovic, Diane | People's Party of Canada | Defeated (unconfirmed) |
| Ontario | Kitchener Centre | Henein Thorn, Mary | Conservative Party of Canada | Defeated (unconfirmed) |
| Ontario | Kitchener Centre | Morrice, Michael | Green Party of Canada | Elected (unconfirmed) |
| Ontario | Kitchener Centre | Papenburg, Elizabeth | Animal Protection Party of Canada | Defeated (unconfirmed) |
| Ontario | Kitchener Centre | Saini, Raj | Liberal Party of Canada | Defeated (unconfirmed) |
| Ontario | Kitchener Centre | Zubi, Beisan | New Democratic Party | Defeated (unconfirmed) |
| Ontario | Kitchener—Conestoga | Bradley, Owen | Green Party of Canada | Defeated (unconfirmed) |
| Ontario | Kitchener—Conestoga | Dupuis, Kevin | People's Party of Canada | Defeated (unconfirmed) |
| Ontario | Kitchener—Conestoga | Hawley, Carlene | Conservative Party of Canada | Defeated (unconfirmed) |
| Ontario | Kitchener—Conestoga | Louis, Tim | Liberal Party of Canada | Re-Elected (unconfirmed) |
| Ontario | Kitchener—Conestoga | Sookram, Narine Dat | New Democratic Party | Defeated (unconfirmed) |
| Ontario | Kitchener South—Hespeler | Arangath, Suresh | New Democratic Party | Defeated (unconfirmed) |
| Ontario | Kitchener South—Hespeler | Baetz, Elaine | Marxist-Leninist Party of Canada | Defeated (unconfirmed) |
| Ontario | Kitchener South—Hespeler | Baumgaertner, Melissa | People's Party of Canada | Defeated (unconfirmed) |
| Ontario | Kitchener South—Hespeler | Bradford, Valerie | Liberal Party of Canada | Elected (unconfirmed) |
| Ontario | Kitchener South—Hespeler | Calver, Tyler | Conservative Party of Canada | Defeated (unconfirmed) |
| Ontario | Kitchener South—Hespeler | Davis, Stephen | Parti Rhinocéros Party | Defeated (unconfirmed) |
| Ontario | Kitchener South—Hespeler | Morrison, C. Andrea | Independent | Defeated (unconfirmed) |
| Ontario | Kitchener South—Hespeler | Rose, Gabriel | Green Party of Canada | Defeated (unconfirmed) |
| Ontario | Lambton—Kent—Middlesex | Henry, Jason | New Democratic Party | Defeated (unconfirmed) |
| Ontario | Lambton—Kent—Middlesex | Hull, Jeremy | Green Party of Canada | Defeated (unconfirmed) |
| Ontario | Lambton—Kent—Middlesex | Mitchell, Kevin | People's Party of Canada | Defeated (unconfirmed) |
| Ontario | Lambton—Kent—Middlesex | Ranade, Sudit | Liberal Party of Canada | Defeated (unconfirmed) |
| Ontario | Lambton—Kent—Middlesex | Rood, Lianne | Conservative Party of Canada | Re-Elected (unconfirmed) |
| Ontario | Lanark—Frontenac—Kingston | Bors, Florian | People's Party of Canada | Defeated (unconfirmed) |
| Ontario | Lanark—Frontenac—Kingston | Foxton, Michelle | Liberal Party of Canada | Defeated (unconfirmed) |
| Ontario | Lanark—Frontenac—Kingston | Garrison, Stephen William | New Democratic Party | Defeated (unconfirmed) |
| Ontario | Lanark—Frontenac—Kingston | Hamilton, Blake | Parti Rhinocéros Party | Defeated (unconfirmed) |
| Ontario | Lanark—Frontenac—Kingston | Neufeld, Calvin | Green Party of Canada | Defeated (unconfirmed) |
| Ontario | Lanark—Frontenac—Kingston | Reid, Scott | Conservative Party of Canada | Re-Elected (unconfirmed) |
| Ontario | Leeds—Grenville—Thousand Islands and Rideau Lakes | Abbott, Roberta | Liberal Party of Canada | Defeated (unconfirmed) |
| Ontario | Leeds—Grenville—Thousand Islands and Rideau Lakes | Barrett, Michael | Conservative Party of Canada | Re-Elected (unconfirmed) |
| Ontario | Leeds—Grenville—Thousand Islands and Rideau Lakes | Cassell, Alexander | People's Party of Canada | Defeated (unconfirmed) |
| Ontario | Leeds—Grenville—Thousand Islands and Rideau Lakes | Rekmans, Lorraine | Green Party of Canada | Defeated (unconfirmed) |
| Ontario | Leeds—Grenville—Thousand Islands and Rideau Lakes | Taylor, Michelle | New Democratic Party | Defeated (unconfirmed) |
| Ontario | London—Fanshawe | Free, Kyle | People's Party of Canada | Defeated (unconfirmed) |
| Ontario | London—Fanshawe | Hammoud, Mohamed | Liberal Party of Canada | Defeated (unconfirmed) |
| Ontario | London—Fanshawe | Mathyssen, Lindsay | New Democratic Party | Re-Elected (unconfirmed) |
| Ontario | London—Fanshawe | Vanderley, Mattias | Conservative Party of Canada | Defeated (unconfirmed) |
| Ontario | London North Centre | Emery, Marc | People's Party of Canada | Defeated (unconfirmed) |
| Ontario | London North Centre | Fragiskatos, Peter | Liberal Party of Canada | Re-Elected (unconfirmed) |
| Ontario | London North Centre | Gallant, Robert Stephen | Conservative Party of Canada | Defeated (unconfirmed) |
| Ontario | London North Centre | Hodge, Mary Ann | Green Party of Canada | Defeated (unconfirmed) |
| Ontario | London North Centre | Prout, Dirka | New Democratic Party | Defeated (unconfirmed) |
| Ontario | London West | Boudreau, Jacques Y. | Libertarian Party of Canada | Defeated (unconfirmed) |
| Ontario | London West | Flack, Robert | Conservative Party of Canada | Defeated (unconfirmed) |
| Ontario | London West | Kayabaga, Arielle | Liberal Party of Canada | Elected (unconfirmed) |
| Ontario | London West | Lewkowitz, Shawna | New Democratic Party | Defeated (unconfirmed) |
| Ontario | London West | Mcmullen, Mike | People's Party of Canada | Defeated (unconfirmed) |
| Ontario | Markham—Stouffville | Baig, Uzair | Green Party of Canada | Defeated (unconfirmed) |
| Ontario | Markham—Stouffville | De Vries, René | People's Party of Canada | Defeated (unconfirmed) |
| Ontario | Markham—Stouffville | Jaczek, Helena | Liberal Party of Canada | Re-Elected (unconfirmed) |
| Ontario | Markham—Stouffville | Sahi, Muhammad | New Democratic Party | Defeated (unconfirmed) |
| Ontario | Markham—Stouffville | Smith, Ben | Conservative Party of Canada | Defeated (unconfirmed) |
| Ontario | Markham—Thornhill | Felian, Melissa | Conservative Party of Canada | Defeated (unconfirmed) |
| Ontario | Markham—Thornhill | Lee, Mimi | Green Party of Canada | Defeated (unconfirmed) |
| Ontario | Markham—Thornhill | Ng, Hon. Mary | Liberal Party of Canada | Re-Elected (unconfirmed) |
| Ontario | Markham—Thornhill | Pashaev, Ilia | People's Party of Canada | Defeated (unconfirmed) |
| Ontario | Markham—Thornhill | Sahbaz, Yeghya | New Democratic Party | Defeated (unconfirmed) |
| Ontario | Markham—Unionville | Chiang, Paul | Liberal Party of Canada | Elected (unconfirmed) |
| Ontario | Markham—Unionville | Kao, Elvin | Green Party of Canada | Defeated (unconfirmed) |
| Ontario | Markham—Unionville | Qureshi, Aftab | New Democratic Party | Defeated (unconfirmed) |
| Ontario | Markham—Unionville | Saroya, Bob | Conservative Party of Canada | Defeated (unconfirmed) |
| Ontario | Milton | Akbar, Nadeem | Conservative Party of Canada | Defeated (unconfirmed) |
| Ontario | Milton | Haddad, Shibli | People's Party of Canada | Defeated (unconfirmed) |
| Ontario | Milton | Kowalchuk, Christopher | Green Party of Canada | Defeated (unconfirmed) |
| Ontario | Milton | Sahi, Muhammad Riaz | New Democratic Party | Defeated (unconfirmed) |
| Ontario | Milton | van Koeverden, Adam | Liberal Party of Canada | Re-Elected (unconfirmed) |
| Ontario | Mississauga Centre | Alghabra, Hon. Omar | Liberal Party of Canada | Re-Elected (unconfirmed) |
| Ontario | Mississauga Centre | Diab, Elie | People's Party of Canada | Defeated (unconfirmed) |
| Ontario | Mississauga Centre | Laferriere, Craig | Green Party of Canada | Defeated (unconfirmed) |
| Ontario | Mississauga Centre | Samuel, Teneshia | New Democratic Party | Defeated (unconfirmed) |
| Ontario | Mississauga Centre | Zhao, Ying | Conservative Party of Canada | Defeated (unconfirmed) |
| Ontario | Mississauga East—Cooksville | Adamu, Grace | Conservative Party of Canada | Defeated (unconfirmed) |
| Ontario | Mississauga East—Cooksville | Elliott, Samuel | Independent | Defeated (unconfirmed) |
| Ontario | Mississauga East—Cooksville | Fonseca, Peter | Liberal Party of Canada | Re-Elected (unconfirmed) |
| Ontario | Mississauga East—Cooksville | Sullivan, Dagmar | Marxist-Leninist Party of Canada | Defeated (unconfirmed) |
| Ontario | Mississauga East—Cooksville | Takacs, Tom | New Democratic Party | Defeated (unconfirmed) |
| Ontario | Mississauga East—Cooksville | Westover, Joseph | People's Party of Canada | Defeated (unconfirmed) |
| Ontario | Mississauga—Erin Mills | Bayer, Michael | People's Party of Canada | Defeated (unconfirmed) |
| Ontario | Mississauga—Erin Mills | DeSilva, Ewan | Green Party of Canada | Defeated (unconfirmed) |
| Ontario | Mississauga—Erin Mills | Khalid, Iqra | Liberal Party of Canada | Re-Elected (unconfirmed) |
| Ontario | Mississauga—Erin Mills | Nguyen, Lam | Conservative Party of Canada | Defeated (unconfirmed) |
| Ontario | Mississauga—Erin Mills | Usman, Kaukab | New Democratic Party | Defeated (unconfirmed) |
| Ontario | Mississauga—Lakeshore | Ras, Michael | Conservative Party of Canada | Defeated (unconfirmed) |
| Ontario | Mississauga—Lakeshore | Robertson, Elizabeth | Green Party of Canada | Defeated (unconfirmed) |
| Ontario | Mississauga—Lakeshore | Seyfaie, Vahid | People's Party of Canada | Defeated (unconfirmed) |
| Ontario | Mississauga—Lakeshore | Spengemann, Sven | Liberal Party of Canada | Re-Elected (unconfirmed) |
| Ontario | Mississauga—Lakeshore | Tahk, Kayleigh | Parti Rhinocéros Party | Defeated (unconfirmed) |
| Ontario | Mississauga—Lakeshore | Walji, Sarah | New Democratic Party | Defeated (unconfirmed) |
| Ontario | Mississauga—Malton | Ahmed, Mohammed Waseemuddin | New Democratic Party | Defeated (unconfirmed) |
| Ontario | Mississauga—Malton | Chilelli, Frank | Marxist-Leninist Party of Canada | Defeated (unconfirmed) |
| Ontario | Mississauga—Malton | Davidson, Mark | Green Party of Canada | Defeated (unconfirmed) |
| Ontario | Mississauga—Malton | Gaheer, Iqwinder | Liberal Party of Canada | Elected (unconfirmed) |
| Ontario | Mississauga—Malton | Roach, Clyde | Conservative Party of Canada | Defeated (unconfirmed) |
| Ontario | Mississauga—Streetsville | Hassan, Farina | New Democratic Party | Defeated (unconfirmed) |
| Ontario | Mississauga—Streetsville | Hill, Chris | Green Party of Canada | Defeated (unconfirmed) |
| Ontario | Mississauga—Streetsville | Rattan, Jasveen | Conservative Party of Canada | Defeated (unconfirmed) |
| Ontario | Mississauga—Streetsville | Spizzirri, Natalie | Animal Protection Party of Canada | Defeated (unconfirmed) |
| Ontario | Mississauga—Streetsville | Valdez, Rechie | Liberal Party of Canada | Elected (unconfirmed) |
| Ontario | Mississauga—Streetsville | Wolosz, Gurdeep | People's Party of Canada | Defeated (unconfirmed) |
| Ontario | Nepean | Arya, Chandra | Liberal Party of Canada | Re-Elected (unconfirmed) |
| Ontario | Nepean | Devine, Sean | New Democratic Party | Defeated (unconfirmed) |
| Ontario | Nepean | Kubanek, Gordon | Green Party of Canada | Defeated (unconfirmed) |
| Ontario | Nepean | Nera, Eduardo Jason | People's Party of Canada | Defeated (unconfirmed) |
| Ontario | Nepean | Triemstra, Matthew | Conservative Party of Canada | Defeated (unconfirmed) |
| Ontario | Newmarket—Aurora | Baxter, Dorian | Independent | Defeated (unconfirmed) |
| Ontario | Newmarket—Aurora | Flemming, Timothy | Green Party of Canada | Defeated (unconfirmed) |
| Ontario | Newmarket—Aurora | Gagnon, Andre | People's Party of Canada | Defeated (unconfirmed) |
| Ontario | Newmarket—Aurora | Kelly, Yvonne | New Democratic Party | Defeated (unconfirmed) |
| Ontario | Newmarket—Aurora | Kim, Harold | Conservative Party of Canada | Defeated (unconfirmed) |
| Ontario | Newmarket—Aurora | Van Bynen, Tony | Liberal Party of Canada | Re-Elected (unconfirmed) |
| Ontario | Niagara Centre | Badawey, Vance | Liberal Party of Canada | Re-Elected (unconfirmed) |
| Ontario | Niagara Centre | Kimmons, Michael | People's Party of Canada | Defeated (unconfirmed) |
| Ontario | Niagara Centre | McCartney, Kurtis | Green Party of Canada | Defeated (unconfirmed) |
| Ontario | Niagara Centre | McGlashan, Melissa | New Democratic Party | Defeated (unconfirmed) |
| Ontario | Niagara Centre | Speck, Graham | Conservative Party of Canada | Defeated (unconfirmed) |
| Ontario | Niagara Falls | Baldinelli, Tony | Conservative Party of Canada | Re-Elected (unconfirmed) |
| Ontario | Niagara Falls | Barker, Brian | New Democratic Party | Defeated (unconfirmed) |
| Ontario | Niagara Falls | Holm, Melanie | Green Party of Canada | Defeated (unconfirmed) |
| Ontario | Niagara Falls | Kaiser, Andrea | Liberal Party of Canada | Defeated (unconfirmed) |
| Ontario | Niagara Falls | Taras, Peter | People's Party of Canada | Defeated (unconfirmed) |
| Ontario | Niagara West | Allison, Dean | Conservative Party of Canada | Re-Elected (unconfirmed) |
| Ontario | Niagara West | Bingham, Ian | Liberal Party of Canada | Defeated (unconfirmed) |
| Ontario | Niagara West | Derkson, Shaunalee | People's Party of Canada | Defeated (unconfirmed) |
| Ontario | Niagara West | Jonker, Harold | Christian Heritage Party of Canada | Defeated (unconfirmed) |
| Ontario | Niagara West | Kocsis, Joanna | Green Party of Canada | Defeated (unconfirmed) |
| Ontario | Niagara West | Rahman, Nameer | New Democratic Party | Defeated (unconfirmed) |
| Ontario | Nickel Belt | Chénier, Andréane Simone | New Democratic Party | Defeated (unconfirmed) |
| Ontario | Nickel Belt | Gravelle, Craig | Green Party of Canada | Defeated (unconfirmed) |
| Ontario | Nickel Belt | Hobbs, David | People's Party of Canada | Defeated (unconfirmed) |
| Ontario | Nickel Belt | Humphrey, Charles | Conservative Party of Canada | Defeated (unconfirmed) |
| Ontario | Nickel Belt | Serré, Marc G. | Liberal Party of Canada | Re-Elected (unconfirmed) |
| Ontario | Nipissing—Timiskaming | Galante, Gregory J | People's Party of Canada | Defeated (unconfirmed) |
| Ontario | Nipissing—Timiskaming | Robertson, Scott | New Democratic Party | Defeated (unconfirmed) |
| Ontario | Nipissing—Timiskaming | Rota, Hon. Anthony | Liberal Party of Canada | Re-Elected (unconfirmed) |
| Ontario | Nipissing—Timiskaming | Trahan, Steven | Conservative Party of Canada | Defeated (unconfirmed) |
| Ontario | Northumberland—Peterborough South | Lang, Nathan | People's Party of Canada | Defeated (unconfirmed) |
| Ontario | Northumberland—Peterborough South | Lawrence, Philip | Conservative Party of Canada | Re-Elected (unconfirmed) |
| Ontario | Northumberland—Peterborough South | Lester, Alison | Liberal Party of Canada | Defeated (unconfirmed) |
| Ontario | Northumberland—Peterborough South | McArthur-Jackson, Kimberly | New Democratic Party | Defeated (unconfirmed) |
| Ontario | Northumberland—Peterborough South | Wilson, Christina | Green Party of Canada | Defeated (unconfirmed) |
| Ontario | Oakville | Adamo, Jerome | New Democratic Party | Defeated (unconfirmed) |
| Ontario | Oakville | Anand, Hon. Anita | Liberal Party of Canada | Re-Elected (unconfirmed) |
| Ontario | Oakville | Colborne, Kerry | Conservative Party of Canada | Defeated (unconfirmed) |
| Ontario | Oakville | Knox, Oriana | Green Party of Canada | Defeated (unconfirmed) |
| Ontario | Oakville | Meaney, John | People's Party of Canada | Defeated (unconfirmed) |
| Ontario | Oakville North—Burlington | Damoff, Pam | Liberal Party of Canada | Re-Elected (unconfirmed) |
| Ontario | Oakville North—Burlington | Dupuis, Lenaee | New Democratic Party | Defeated (unconfirmed) |
| Ontario | Oakville North—Burlington | Jubinville, Gilbert Joseph | People's Party of Canada | Defeated (unconfirmed) |
| Ontario | Oakville North—Burlington | Rizkalla, Hanan | Conservative Party of Canada | Defeated (unconfirmed) |
| Ontario | Oakville North—Burlington | Sousa, Bruno | Green Party of Canada | Defeated (unconfirmed) |
| Ontario | Orléans | Cléroux, André Junior | Free Party Canada | Defeated (unconfirmed) |
| Ontario | Orléans | Hartnett, Michael Fintan | Green Party of Canada | Defeated (unconfirmed) |
| Ontario | Orléans | Joanis, Jessica | New Democratic Party | Defeated (unconfirmed) |
| Ontario | Orléans | Lalonde, Marie-France | Liberal Party of Canada | Re-Elected (unconfirmed) |
| Ontario | Orléans | Oklobdzija, Spencer | People's Party of Canada | Defeated (unconfirmed) |
| Ontario | Orléans | Wolfe, Mary-Elsie | Conservative Party of Canada | Defeated (unconfirmed) |
| Ontario | Oshawa | Carrie, Colin | Conservative Party of Canada | Re-Elected (unconfirmed) |
| Ontario | Oshawa | Hossain, Afroza | Liberal Party of Canada | Defeated (unconfirmed) |
| Ontario | Oshawa | Mackie, Darryl | People's Party of Canada | Defeated (unconfirmed) |
| Ontario | Oshawa | Mir, Sonny | Green Party of Canada | Defeated (unconfirmed) |
| Ontario | Oshawa | Panylo, Shailene | New Democratic Party | Defeated (unconfirmed) |
| Ontario | Ottawa Centre | Bertrand, Shelby | Animal Protection Party of Canada | Defeated (unconfirmed) |
| Ontario | Ottawa Centre | Clemenhagen, Carol | Conservative Party of Canada | Defeated (unconfirmed) |
| Ontario | Ottawa Centre | Joyal, Richard "Rich" | Independent | Defeated (unconfirmed) |
| Ontario | Ottawa Centre | Keller-Herzog, Angela | Green Party of Canada | Defeated (unconfirmed) |
| Ontario | Ottawa Centre | MacEwen, Angella | New Democratic Party | Defeated (unconfirmed) |
| Ontario | Ottawa Centre | McDonald, Robert Alex | Communist Party of Canada | Defeated (unconfirmed) |
| Ontario | Ottawa Centre | Naqvi, Yasir | Liberal Party of Canada | Elected (unconfirmed) |
| Ontario | Ottawa Centre | Watteel, Regina | People's Party of Canada | Defeated (unconfirmed) |
| Ontario | Ottawa South | Hall, Chylow | People's Party of Canada | Defeated (unconfirmed) |
| Ontario | Ottawa South | McGuinty, Hon. David J. | Liberal Party of Canada | Re-Elected (unconfirmed) |
| Ontario | Ottawa South | Mukbil, Huda | New Democratic Party | Defeated (unconfirmed) |
| Ontario | Ottawa South | Schram, Les | Green Party of Canada | Defeated (unconfirmed) |
| Ontario | Ottawa South | Tannis, Eli | Conservative Party of Canada | Defeated (unconfirmed) |
| Ontario | Ottawa South | Wasslen, Larry | Communist Party of Canada | Defeated (unconfirmed) |
| Ontario | Ottawa—Vanier | Desgranges, Jean-Jacques | People's Party of Canada | Defeated (unconfirmed) |
| Ontario | Ottawa—Vanier | Elford, Daniel | Libertarian Party of Canada | Defeated (unconfirmed) |
| Ontario | Ottawa—Vanier | Fortier, Hon. Mona | Liberal Party of Canada | Re-Elected (unconfirmed) |
| Ontario | Ottawa—Vanier | Inamuco, Lyse-Pascale | New Democratic Party | Defeated (unconfirmed) |
| Ontario | Ottawa—Vanier | Jensen, Victoria Heidi | Conservative Party of Canada | Defeated (unconfirmed) |
| Ontario | Ottawa—Vanier | Leriche, Marie-Chantal | Independent | Defeated (unconfirmed) |
| Ontario | Ottawa—Vanier | Pelletier-Bourguignon, Crystelle | Free Party Canada | Defeated (unconfirmed) |
| Ontario | Ottawa—Vanier | Proulx, Christian | Green Party of Canada | Defeated (unconfirmed) |
| Ontario | Ottawa West—Nepean | Hameed, Yavar | New Democratic Party | Defeated (unconfirmed) |
| Ontario | Ottawa West—Nepean | Jennekens-Daviau, Jennifer | Conservative Party of Canada | Defeated (unconfirmed) |
| Ontario | Ottawa West—Nepean | Mulligan, Sean J. | Christian Heritage Party of Canada | Defeated (unconfirmed) |
| Ontario | Ottawa West—Nepean | Stibbe, David | Green Party of Canada | Defeated (unconfirmed) |
| Ontario | Ottawa West—Nepean | Vandenbeld, Anita | Liberal Party of Canada | Re-Elected (unconfirmed) |
| Ontario | Ottawa West—Nepean | Yeo, David | People's Party of Canada | Defeated (unconfirmed) |
| Ontario | Oxford | Chambers, Matthew | New Democratic Party | Defeated (unconfirmed) |
| Ontario | Oxford | MacKenzie, Dave | Conservative Party of Canada | Re-Elected (unconfirmed) |
| Ontario | Oxford | Martin, Wendy | People's Party of Canada | Defeated (unconfirmed) |
| Ontario | Oxford | Quinto, Elizabeth | Liberal Party of Canada | Defeated (unconfirmed) |
| Ontario | Oxford | Reid, Bob | Green Party of Canada | Defeated (unconfirmed) |
| Ontario | Oxford | Scovil, Allen | Christian Heritage Party of Canada | Defeated (unconfirmed) |
| Ontario | Parkdale—High Park | Danzinger, Wilfried Richard Alexander | People's Party of Canada | Defeated (unconfirmed) |
| Ontario | Parkdale—High Park | Gershuny, Lorne | Marxist-Leninist Party of Canada | Defeated (unconfirmed) |
| Ontario | Parkdale—High Park | Marchand-Lafortune, Diem | Green Party of Canada | Defeated (unconfirmed) |
| Ontario | Parkdale—High Park | Parker, Terrence | Marijuana Party | Defeated (unconfirmed) |
| Ontario | Parkdale—High Park | Sanajko, Nestor | Conservative Party of Canada | Defeated (unconfirmed) |
| Ontario | Parkdale—High Park | Taylor, Paul | New Democratic Party | Defeated (unconfirmed) |
| Ontario | Parkdale—High Park | Virani, Arif | Liberal Party of Canada | Re-Elected (unconfirmed) |
| Ontario | Parry Sound—Muskoka | Aitchison, Scott | Conservative Party of Canada | Re-Elected (unconfirmed) |
| Ontario | Parry Sound—Muskoka | Fawcett, James | National Citizens Alliance of Canada | Defeated (unconfirmed) |
| Ontario | Parry Sound—Muskoka | Hay, Heather | New Democratic Party | Defeated (unconfirmed) |
| Ontario | Parry Sound—Muskoka | Mantha, Marc | Green Party of Canada | Defeated (unconfirmed) |
| Ontario | Parry Sound—Muskoka | Nicoyishakiye, Jovanie | Liberal Party of Canada | Defeated (unconfirmed) |
| Ontario | Parry Sound—Muskoka | Predie Jr, Daniel | Independent | Defeated (unconfirmed) |
| Ontario | Parry Sound—Muskoka | Tole, James | People's Party of Canada | Defeated (unconfirmed) |
| Ontario | Perth—Wellington | Baker, Wayne | People's Party of Canada | Defeated (unconfirmed) |
| Ontario | Perth—Wellington | Knight, Brendan | Liberal Party of Canada | Defeated (unconfirmed) |
| Ontario | Perth—Wellington | Kruchkywich, Kevin | New Democratic Party | Defeated (unconfirmed) |
| Ontario | Perth—Wellington | Nater, John | Conservative Party of Canada | Re-Elected (unconfirmed) |
| Ontario | Peterborough—Kawartha | Bowers, Robert M | Independent | Defeated (unconfirmed) |
| Ontario | Peterborough—Kawartha | Ferreri, Michelle | Conservative Party of Canada | Elected (unconfirmed) |
| Ontario | Peterborough—Kawartha | Lachica, Joy | New Democratic Party | Defeated (unconfirmed) |
| Ontario | Peterborough—Kawartha | Lawton, Paul | People's Party of Canada | Defeated (unconfirmed) |
| Ontario | Peterborough—Kawartha | Monsef, Hon. Maryam | Liberal Party of Canada | Defeated (unconfirmed) |
| Ontario | Peterborough—Kawartha | White, Chanté | Green Party of Canada | Defeated (unconfirmed) |
| Ontario | Pickering—Uxbridge | Chisu, Corneliu | People's Party of Canada | Defeated (unconfirmed) |
| Ontario | Pickering—Uxbridge | Higdon, Eileen | New Democratic Party | Defeated (unconfirmed) |
| Ontario | Pickering—Uxbridge | Mantle, Jacob | Conservative Party of Canada | Defeated (unconfirmed) |
| Ontario | Pickering—Uxbridge | O'Connell, Jennifer | Liberal Party of Canada | Re-Elected (unconfirmed) |
| Ontario | Renfrew—Nipissing—Pembroke | Ainsworth, David | People's Party of Canada | Defeated (unconfirmed) |
| Ontario | Renfrew—Nipissing—Pembroke | Gallant, Cheryl | Conservative Party of Canada | Re-Elected (unconfirmed) |
| Ontario | Renfrew—Nipissing—Pembroke | Klietsch, Stefan | Independent | Defeated (unconfirmed) |
| Ontario | Renfrew—Nipissing—Pembroke | Lariviere, Michael | Green Party of Canada | Defeated (unconfirmed) |
| Ontario | Renfrew—Nipissing—Pembroke | Mills, Cynthia | Liberal Party of Canada | Defeated (unconfirmed) |
| Ontario | Renfrew—Nipissing—Pembroke | Primeau, Jodie | New Democratic Party | Defeated (unconfirmed) |
| Ontario | Richmond Hill | DeVita, Adam | New Democratic Party | Defeated (unconfirmed) |
| Ontario | Richmond Hill | DiPaola, Charity | Independent | Defeated (unconfirmed) |
| Ontario | Richmond Hill | Jowhari, Majid | Liberal Party of Canada | Re-Elected (unconfirmed) |
| Ontario | Richmond Hill | Keller, Angelika | Independent | Defeated (unconfirmed) |
| Ontario | Richmond Hill | Menegakis, Costas | Conservative Party of Canada | Defeated (unconfirmed) |
| Ontario | Richmond Hill | Tvorogov, Igor | People's Party of Canada | Defeated (unconfirmed) |
| Ontario | Sarnia—Lambton | Everaert, Brian | People's Party of Canada | Defeated (unconfirmed) |
| Ontario | Sarnia—Lambton | Gladu, Marilyn | Conservative Party of Canada | Re-Elected (unconfirmed) |
| Ontario | Sarnia—Lambton | Kilner, Adam | New Democratic Party | Defeated (unconfirmed) |
| Ontario | Sarnia—Lambton | Laird, Thomas | Christian Heritage Party of Canada | Defeated (unconfirmed) |
| Ontario | Sarnia—Lambton | Nantais, Lois | Liberal Party of Canada | Defeated (unconfirmed) |
| Ontario | Sarnia—Lambton | Randell, Stefanie | Green Party of Canada | Defeated (unconfirmed) |
| Ontario | Sault Ste. Marie | Makowski, Kacper | People's Party of Canada | Defeated (unconfirmed) |
| Ontario | Sault Ste. Marie | Morin-Strom, Marie | New Democratic Party | Defeated (unconfirmed) |
| Ontario | Sault Ste. Marie | Sheehan, Terry | Liberal Party of Canada | Re-Elected (unconfirmed) |
| Ontario | Sault Ste. Marie | Spina, Sonny | Conservative Party of Canada | Defeated (unconfirmed) |
| Ontario | Scarborough—Agincourt | Balasingham, Arjun | Green Party of Canada | Defeated (unconfirmed) |
| Ontario | Scarborough—Agincourt | Johnson, Mark | Conservative Party of Canada | Defeated (unconfirmed) |
| Ontario | Scarborough—Agincourt | Julius, Larisa | New Democratic Party | Defeated (unconfirmed) |
| Ontario | Scarborough—Agincourt | Muraven, Eric | People's Party of Canada | Defeated (unconfirmed) |
| Ontario | Scarborough—Agincourt | Yip, Jean | Liberal Party of Canada | Re-Elected (unconfirmed) |
| Ontario | Scarborough Centre | Kamal, Faiz | New Democratic Party | Defeated (unconfirmed) |
| Ontario | Scarborough Centre | Ponnayan, Malcolm | Conservative Party of Canada | Defeated (unconfirmed) |
| Ontario | Scarborough Centre | Rozoveanu, Petru | People's Party of Canada | Defeated (unconfirmed) |
| Ontario | Scarborough Centre | Thengampallil, Aylwin T Mathew | National Citizens Alliance of Canada | Defeated (unconfirmed) |
| Ontario | Scarborough Centre | Zahid, Salma | Liberal Party of Canada | Re-Elected (unconfirmed) |
| Ontario | Scarborough—Guildwood | Bountrogiannis, James | People's Party of Canada | Defeated (unconfirmed) |
| Ontario | Scarborough—Guildwood | Clarke, Kevin M. | Independent | Defeated (unconfirmed) |
| Ontario | Scarborough—Guildwood | Day, Opa | Independent | Defeated (unconfirmed) |
| Ontario | Scarborough—Guildwood | Khan, Aslam | Centrist Party of Canada | Defeated (unconfirmed) |
| Ontario | Scarborough—Guildwood | McKay, Hon. John | Liberal Party of Canada | Re-Elected (unconfirmed) |
| Ontario | Scarborough—Guildwood | Spencer, Michelle | New Democratic Party | Defeated (unconfirmed) |
| Ontario | Scarborough—Guildwood | Stefanis, Gus | Canadian Nationalist Party | Defeated (unconfirmed) |
| Ontario | Scarborough—Guildwood | Wilson-Durston, Carmen | Conservative Party of Canada | Defeated (unconfirmed) |
| Ontario | Scarborough North | Chen, Shaun | Liberal Party of Canada | Re-Elected (unconfirmed) |
| Ontario | Scarborough North | Khan, Sheraz | Centrist Party of Canada | Defeated (unconfirmed) |
| Ontario | Scarborough North | Love, Christina | New Democratic Party | Defeated (unconfirmed) |
| Ontario | Scarborough North | Moore, David | People's Party of Canada | Defeated (unconfirmed) |
| Ontario | Scarborough North | Shah, Fazal | Conservative Party of Canada | Defeated (unconfirmed) |
| Ontario | Scarborough—Rouge Park | Anandasangaree, Gary | Liberal Party of Canada | Re-Elected (unconfirmed) |
| Ontario | Scarborough—Rouge Park | Choudhary, Ashhar Zia | Conservative Party of Canada | Defeated (unconfirmed) |
| Ontario | Scarborough—Rouge Park | Kwok, Kingsley | New Democratic Party | Defeated (unconfirmed) |
| Ontario | Scarborough—Rouge Park | Rehman, Asad | People's Party of Canada | Defeated (unconfirmed) |
| Ontario | Scarborough Southwest | Arale, Guled | New Democratic Party | Defeated (unconfirmed) |
| Ontario | Scarborough Southwest | Bhuiyan, Sahiduzzaman | Conservative Party of Canada | Defeated (unconfirmed) |
| Ontario | Scarborough Southwest | Blair, Hon. Bill | Liberal Party of Canada | Re-Elected (unconfirmed) |
| Ontario | Scarborough Southwest | Cain, Amanda | Green Party of Canada | Defeated (unconfirmed) |
| Ontario | Scarborough Southwest | Pache, Ramona | People's Party of Canada | Defeated (unconfirmed) |
| Ontario | Scarborough Southwest | Poon, David Edward-Ooi | Independent | Defeated (unconfirmed) |
| Ontario | Simcoe—Grey | Clayton, Nicholas | Green Party of Canada | Defeated (unconfirmed) |
| Ontario | Simcoe—Grey | Dowdall, Terry | Conservative Party of Canada | Re-Elected (unconfirmed) |
| Ontario | Simcoe—Grey | Gillies, Lucas | New Democratic Party | Defeated (unconfirmed) |
| Ontario | Simcoe—Grey | Minatel, Adam | People's Party of Canada | Defeated (unconfirmed) |
| Ontario | Simcoe—Grey | Munro, Bren | Liberal Party of Canada | Defeated (unconfirmed) |
| Ontario | Simcoe—Grey | Stouffer, Kenneth | Christian Heritage Party of Canada | Defeated (unconfirmed) |
| Ontario | Simcoe North | Brooks, Krystal | Green Party of Canada | Defeated (unconfirmed) |
| Ontario | Simcoe North | Chambers, Adam | Conservative Party of Canada | Elected (unconfirmed) |
| Ontario | Simcoe North | Durnford, Janet-Lynne | New Democratic Party | Defeated (unconfirmed) |
| Ontario | Simcoe North | Emo, Russ | Christian Heritage Party of Canada | Defeated (unconfirmed) |
| Ontario | Simcoe North | Makk, Stephen | People's Party of Canada | Defeated (unconfirmed) |
| Ontario | Simcoe North | Wesley-Esquimaux, Cynthia | Liberal Party of Canada | Defeated (unconfirmed) |
| Ontario | Spadina—Fort York | Di Pasquale, Norman | New Democratic Party | Defeated (unconfirmed) |
| Ontario | Spadina—Fort York | Jandu, Sukhmandeep | Conservative Party of Canada | Defeated (unconfirmed) |
| Ontario | Spadina—Fort York | Roden, Ian | People's Party of Canada | Defeated (unconfirmed) |
| Ontario | Spadina—Fort York | Rosenstock, Amanda | Green Party of Canada | Defeated (unconfirmed) |
| Ontario | Spadina—Fort York | Vuong, Kevin | Liberal Party of Canada | Elected (unconfirmed) |
| Ontario | St. Catharines | Bittle, Chris | Liberal Party of Canada | Re-Elected (unconfirmed) |
| Ontario | St. Catharines | Hahn, Rebecca | People's Party of Canada | Defeated (unconfirmed) |
| Ontario | St. Catharines | McLennon, Trecia | New Democratic Party | Defeated (unconfirmed) |
| Ontario | St. Catharines | Rhodes, Catharine | Green Party of Canada | Defeated (unconfirmed) |
| Ontario | St. Catharines | Waler, Krystina | Conservative Party of Canada | Defeated (unconfirmed) |
| Ontario | Stormont—Dundas—South Glengarry | Anber, David | People's Party of Canada | Defeated (unconfirmed) |
| Ontario | Stormont—Dundas—South Glengarry | Duncan, Eric | Conservative Party of Canada | Re-Elected (unconfirmed) |
| Ontario | Stormont—Dundas—South Glengarry | Kennedy, Trevor | New Democratic Party | Defeated (unconfirmed) |
| Ontario | Stormont—Dundas—South Glengarry | Moquin, Denis | Liberal Party of Canada | Defeated (unconfirmed) |
| Ontario | Stormont—Dundas—South Glengarry | Warnock, Jeanie | Green Party of Canada | Defeated (unconfirmed) |
| Ontario | Sudbury | LaPointe, Viviane | Liberal Party of Canada | Elected (unconfirmed) |
| Ontario | Sudbury | Methé, Colette Andréa | People's Party of Canada | Defeated (unconfirmed) |
| Ontario | Sudbury | Popescu, J. David | Independent | Defeated (unconfirmed) |
| Ontario | Sudbury | Robinson, David | Green Party of Canada | Defeated (unconfirmed) |
| Ontario | Sudbury | Symington, Ian | Conservative Party of Canada | Defeated (unconfirmed) |
| Ontario | Sudbury | Verrelli, Nadia | New Democratic Party | Defeated (unconfirmed) |
| Ontario | Thornhill | Gladstone, Gary | Liberal Party of Canada | Defeated (unconfirmed) |
| Ontario | Thornhill | Greenfield, Samuel | People's Party of Canada | Defeated (unconfirmed) |
| Ontario | Thornhill | Lantsman, Melissa | Conservative Party of Canada | Elected (unconfirmed) |
| Ontario | Thornhill | Mikanovsky, Daniella | Green Party of Canada | Defeated (unconfirmed) |
| Ontario | Thornhill | Razvi, Syed Ahsan | New Democratic Party | Defeated (unconfirmed) |
| Ontario | Thunder Bay—Rainy River | Aubut, Alan | People's Party of Canada | Defeated (unconfirmed) |
| Ontario | Thunder Bay—Rainy River | MacKinnon, Tracey | Green Party of Canada | Defeated (unconfirmed) |
| Ontario | Thunder Bay—Rainy River | Pecchia, Adelina | Conservative Party of Canada | Defeated (unconfirmed) |
| Ontario | Thunder Bay—Rainy River | Powlowski, Marcus | Liberal Party of Canada | Re-Elected (unconfirmed) |
| Ontario | Thunder Bay—Rainy River | Won, Yuk-Sem | New Democratic Party | Defeated (unconfirmed) |
| Ontario | Thunder Bay—Superior North | Bryson, Chantelle | New Democratic Party | Defeated (unconfirmed) |
| Ontario | Thunder Bay—Superior North | Daines, Rick | People's Party of Canada | Defeated (unconfirmed) |
| Ontario | Thunder Bay—Superior North | Hajdu, Hon. Patty | Liberal Party of Canada | Re-Elected (unconfirmed) |
| Ontario | Thunder Bay—Superior North | Moddejonge, Amanda | Green Party of Canada | Defeated (unconfirmed) |
| Ontario | Thunder Bay—Superior North | Taylor, Joshua | Conservative Party of Canada | Defeated (unconfirmed) |
| Ontario | Thunder Bay—Superior North | Vodden, Alexander | Libertarian Party of Canada | Defeated (unconfirmed) |
| Ontario | Timmins—James Bay | Angus, Charlie | New Democratic Party | Re-Elected (unconfirmed) |
| Ontario | Timmins—James Bay | Black, Steven | Liberal Party of Canada | Defeated (unconfirmed) |
| Ontario | Timmins—James Bay | Ellerton, Morgan | Conservative Party of Canada | Defeated (unconfirmed) |
| Ontario | Timmins—James Bay | MacLeod, Stephen | People's Party of Canada | Defeated (unconfirmed) |
| Ontario | Toronto Centre | Byard, Ivan | Communist Party of Canada | Defeated (unconfirmed) |
| Ontario | Toronto Centre | Chang, Brian | New Democratic Party | Defeated (unconfirmed) |
| Ontario | Toronto Centre | Ien, Marci | Liberal Party of Canada | Re-Elected (unconfirmed) |
| Ontario | Toronto Centre | Jaffery, Syed | People's Party of Canada | Defeated (unconfirmed) |
| Ontario | Toronto Centre | Lester, Ryan | Conservative Party of Canada | Defeated (unconfirmed) |
| Ontario | Toronto Centre | Paul, Annamie | Green Party of Canada | Defeated (unconfirmed) |
| Ontario | Toronto Centre | Stubbins, Peter | Animal Protection Party of Canada | Defeated (unconfirmed) |
| Ontario | Toronto—Danforth | Carey, Michael | Conservative Party of Canada | Defeated (unconfirmed) |
| Ontario | Toronto—Danforth | Dabrusin, Julie | Liberal Party of Canada | Re-Elected (unconfirmed) |
| Ontario | Toronto—Danforth | Desai, Habiba | Independent | Defeated (unconfirmed) |
| Ontario | Toronto—Danforth | Hacksel, Clare | New Democratic Party | Defeated (unconfirmed) |
| Ontario | Toronto—Danforth | Rowley, Elizabeth | Communist Party of Canada | Defeated (unconfirmed) |
| Ontario | Toronto—Danforth | Simmons, Wayne | People's Party of Canada | Defeated (unconfirmed) |
| Ontario | Toronto—Danforth | Tollar, Maryem | Green Party of Canada | Defeated (unconfirmed) |
| Ontario | Toronto—Danforth | White, Liz | Animal Protection Party of Canada | Defeated (unconfirmed) |
| Ontario | Toronto—St. Paul's | Bennett, Hon. Carolyn | Liberal Party of Canada | Re-Elected (unconfirmed) |
| Ontario | Toronto—St. Paul's | Coles, Sidney | New Democratic Party | Defeated (unconfirmed) |
| Ontario | Toronto—St. Paul's | De Luna, Phil | Green Party of Canada | Defeated (unconfirmed) |
| Ontario | Toronto—St. Paul's | Osadchuk, Stephanie | Conservative Party of Canada | Defeated (unconfirmed) |
| Ontario | Toronto—St. Paul's | Remedios, Peter | People's Party of Canada | Defeated (unconfirmed) |
| Ontario | University—Rosedale | Freeland, Hon. Chrystia | Liberal Party of Canada | Re-Elected (unconfirmed) |
| Ontario | University—Rosedale | Garvie, Andrew | Communist Party of Canada | Defeated (unconfirmed) |
| Ontario | University—Rosedale | Grant, Timothy | Green Party of Canada | Defeated (unconfirmed) |
| Ontario | University—Rosedale | Kent, David | People's Party of Canada | Defeated (unconfirmed) |
| Ontario | University—Rosedale | Robicheau, Nicole | New Democratic Party | Defeated (unconfirmed) |
| Ontario | University—Rosedale | Taylor, Steven | Conservative Party of Canada | Defeated (unconfirmed) |
| Ontario | Vaughan—Woodbridge | DeVita, Peter | New Democratic Party | Defeated (unconfirmed) |
| Ontario | Vaughan—Woodbridge | Greco, Mario | People's Party of Canada | Defeated (unconfirmed) |
| Ontario | Vaughan—Woodbridge | Khan, Muhammad Hassan | Green Party of Canada | Defeated (unconfirmed) |
| Ontario | Vaughan—Woodbridge | Mele, Luca | Independent | Defeated (unconfirmed) |
| Ontario | Vaughan—Woodbridge | Panacci, Angela | Conservative Party of Canada | Defeated (unconfirmed) |
| Ontario | Vaughan—Woodbridge | Sorbara, Francesco | Liberal Party of Canada | Re-Elected (unconfirmed) |
| Ontario | Waterloo | Cassels, Jonathan | New Democratic Party | Defeated (unconfirmed) |
| Ontario | Waterloo | Chagger, Hon. Bardish | Liberal Party of Canada | Re-Elected (unconfirmed) |
| Ontario | Waterloo | Doucette, Patrick | People's Party of Canada | Defeated (unconfirmed) |
| Ontario | Waterloo | Shannon, Meghan | Conservative Party of Canada | Defeated (unconfirmed) |
| Ontario | Waterloo | Villagomez Fajardo, Karla | Green Party of Canada | Defeated (unconfirmed) |
| Ontario | Wellington—Halton Hills | Carle, Sylvain | People's Party of Canada | Defeated (unconfirmed) |
| Ontario | Wellington—Halton Hills | Chong, Hon. Michael D. | Conservative Party of Canada | Re-Elected (unconfirmed) |
| Ontario | Wellington—Halton Hills | Jahangir, Noor | New Democratic Party | Defeated (unconfirmed) |
| Ontario | Wellington—Halton Hills | Lang, Melanie | Liberal Party of Canada | Defeated (unconfirmed) |
| Ontario | Wellington—Halton Hills | Zhu, Ran | Green Party of Canada | Defeated (unconfirmed) |
| Ontario | Whitby | Androvic, Thomas | People's Party of Canada | Defeated (unconfirmed) |
| Ontario | Whitby | Dias, Brian | New Democratic Party | Defeated (unconfirmed) |
| Ontario | Whitby | Kotilainen, Johannes | Green Party of Canada | Defeated (unconfirmed) |
| Ontario | Whitby | Shahid, Maleeha | Conservative Party of Canada | Defeated (unconfirmed) |
| Ontario | Whitby | Turnbull, Ryan | Liberal Party of Canada | Re-Elected (unconfirmed) |
| Ontario | Willowdale | Berman, Hal | New Democratic Party | Defeated (unconfirmed) |
| Ontario | Willowdale | Ehsassi, Ali | Liberal Party of Canada | Re-Elected (unconfirmed) |
| Ontario | Willowdale | Gorka, Anna | Green Party of Canada | Defeated (unconfirmed) |
| Ontario | Willowdale | Lee, Ki-Seok | Conservative Party of Canada | Defeated (unconfirmed) |
| Ontario | Willowdale | Wahab, Subhan | People's Party of Canada | Defeated (unconfirmed) |
| Ontario | Windsor—Tecumseh | Borrelli, Kathryn | Conservative Party of Canada | Defeated (unconfirmed) |
| Ontario | Windsor—Tecumseh | Chesnik, Laura | Marxist-Leninist Party of Canada | Defeated (unconfirmed) |
| Ontario | Windsor—Tecumseh | Green, Victor | People's Party of Canada | Defeated (unconfirmed) |
| Ontario | Windsor—Tecumseh | Hardcastle, Cheryl | New Democratic Party | Defeated (unconfirmed) |
| Ontario | Windsor—Tecumseh | Kusmierczyk, Irek | Liberal Party of Canada | Re-Elected (unconfirmed) |
| Ontario | Windsor—Tecumseh | Oulevey, Henry | Green Party of Canada | Defeated (unconfirmed) |
| Ontario | Windsor West | Giancola, Matthew | People's Party of Canada | Defeated (unconfirmed) |
| Ontario | Windsor West | Masse, Brian | New Democratic Party | Re-Elected (unconfirmed) |
| Ontario | Windsor West | Orlando, Anthony | Conservative Party of Canada | Defeated (unconfirmed) |
| Ontario | Windsor West | Pupatello, The Hon. Sandra | Liberal Party of Canada | Defeated (unconfirmed) |
| Ontario | Windsor West | Villamizar, Margaret | Marxist-Leninist Party of Canada | Defeated (unconfirmed) |
| Ontario | York Centre | Ahmed, Kemal | New Democratic Party | Defeated (unconfirmed) |
| Ontario | York Centre | Etienne, Joel | Conservative Party of Canada | Defeated (unconfirmed) |
| Ontario | York Centre | Nguyen, Trung Hai | People's Party of Canada | Defeated (unconfirmed) |
| Ontario | York Centre | Saks, Ya'ara | Liberal Party of Canada | Re-Elected (unconfirmed) |
| Ontario | York—Simcoe | Davidson, Scot | Conservative Party of Canada | Re-Elected (unconfirmed) |
| Ontario | York—Simcoe | Jenkins, Benjamin | New Democratic Party | Defeated (unconfirmed) |
| Ontario | York—Simcoe | Johnson, Daniella | Liberal Party of Canada | Defeated (unconfirmed) |
| Ontario | York—Simcoe | Lotter, Michael | People's Party of Canada | Defeated (unconfirmed) |
| Ontario | York South—Weston | Chiu, Sitara | People's Party of Canada | Defeated (unconfirmed) |
| Ontario | York South—Weston | Hussen, Hon. Ahmed | Liberal Party of Canada | Re-Elected (unconfirmed) |
| Ontario | York South—Weston | Mire, Hawa | New Democratic Party | Defeated (unconfirmed) |
| Ontario | York South—Weston | Mohan, Sajanth | Conservative Party of Canada | Defeated (unconfirmed) |
| Ontario | York South—Weston | Ward, Nicki | Green Party of Canada | Defeated (unconfirmed) |
| Prince Edward Island | Cardigan | Hardy, Kevin | People's Party of Canada | Defeated (unconfirmed) |
| Prince Edward Island | Cardigan | MacAulay, Hon. Lawrence | Liberal Party of Canada | Re-Elected (unconfirmed) |
| Prince Edward Island | Cardigan | MacLean, Michael | Green Party of Canada | Defeated (unconfirmed) |
| Prince Edward Island | Cardigan | MacLeod, Frederick | Christian Heritage Party of Canada | Defeated (unconfirmed) |
| Prince Edward Island | Cardigan | Phelan, Wayne | Conservative Party of Canada | Defeated (unconfirmed) |
| Prince Edward Island | Cardigan | Thiele, Lynne | New Democratic Party | Defeated (unconfirmed) |
| Prince Edward Island | Charlottetown | Andrade, Margaret | New Democratic Party | Defeated (unconfirmed) |
| Prince Edward Island | Charlottetown | Casey, Sean | Liberal Party of Canada | Re-Elected (unconfirmed) |
| Prince Edward Island | Charlottetown | Currie, Doug | Conservative Party of Canada | Defeated (unconfirmed) |
| Prince Edward Island | Charlottetown | Lanthier, Darcie | Green Party of Canada | Defeated (unconfirmed) |
| Prince Edward Island | Charlottetown | McPhee, Scott | People's Party of Canada | Defeated (unconfirmed) |
| Prince Edward Island | Egmont | Balsom, Barry | Conservative Party of Canada | Defeated (unconfirmed) |
| Prince Edward Island | Egmont | Biggar, Wayne | People's Party of Canada | Defeated (unconfirmed) |
| Prince Edward Island | Egmont | Bradshaw, Lisa | New Democratic Party | Defeated (unconfirmed) |
| Prince Edward Island | Egmont | Clark, Jeffrey Alexander | Green Party of Canada | Defeated (unconfirmed) |
| Prince Edward Island | Egmont | Morrissey, Robert J. | Liberal Party of Canada | Re-Elected (unconfirmed) |
| Prince Edward Island | Malpeque | Keenan, Anna | Green Party of Canada | Defeated (unconfirmed) |
| Prince Edward Island | Malpeque | Landry, Christopher | People's Party of Canada | Defeated (unconfirmed) |
| Prince Edward Island | Malpeque | MacDonald, Heath | Liberal Party of Canada | Elected (unconfirmed) |
| Prince Edward Island | Malpeque | Neill, Michelle | New Democratic Party | Defeated (unconfirmed) |
| Prince Edward Island | Malpeque | Sanderson, Jody | Conservative Party of Canada | Defeated (unconfirmed) |
| Quebec | Abitibi—Baie-James—Nunavik—Eeyou | Bérubé, Sylvie | Bloc Québécois | Re-Elected (unconfirmed) |
| Quebec | Abitibi—Baie-James—Nunavik—Eeyou | Brazeau, Cédric | Free Party Canada | Defeated (unconfirmed) |
| Quebec | Abitibi—Baie-James—Nunavik—Eeyou | Cloutier, Michaël | People's Party of Canada | Defeated (unconfirmed) |
| Quebec | Abitibi—Baie-James—Nunavik—Eeyou | Corriveau, Steve | Conservative Party of Canada | Defeated (unconfirmed) |
| Quebec | Abitibi—Baie-James—Nunavik—Eeyou | Kistabish, Lise | Liberal Party of Canada | Defeated (unconfirmed) |
| Quebec | Abitibi—Baie-James—Nunavik—Eeyou | Lameboy, Pauline | New Democratic Party | Defeated (unconfirmed) |
| Quebec | Abitibi—Baie-James—Nunavik—Eeyou | Levesque, Jimmy | Marijuana Party | Defeated (unconfirmed) |
| Quebec | Abitibi—Baie-James—Nunavik—Eeyou | Pilon, Didier | Green Party of Canada | Defeated (unconfirmed) |
| Quebec | Abitibi—Témiscamingue | Chartrand, Martin | Green Party of Canada | Defeated (unconfirmed) |
| Quebec | Abitibi—Témiscamingue | Gonzalez Venegas, Luis Henry | Conservative Party of Canada | Defeated (unconfirmed) |
| Quebec | Abitibi—Témiscamingue | Goulet, Dany | Free Party Canada | Defeated (unconfirmed) |
| Quebec | Abitibi—Témiscamingue | Lacroix, Eric | People's Party of Canada | Defeated (unconfirmed) |
| Quebec | Abitibi—Témiscamingue | Legault-Lacasse, William | Liberal Party of Canada | Defeated (unconfirmed) |
| Quebec | Abitibi—Témiscamingue | Lemire, Sébastien | Bloc Québécois | Re-Elected (unconfirmed) |
| Quebec | Abitibi—Témiscamingue | Lirette, Joël | Parti Rhinocéros Party | Defeated (unconfirmed) |
| Quebec | Abitibi—Témiscamingue | Stewart, Bethany | New Democratic Party | Defeated (unconfirmed) |
| Quebec | Ahuntsic-Cartierville | Chaabi, Ghada | New Democratic Party | Defeated (unconfirmed) |
| Quebec | Ahuntsic-Cartierville | Chevalier, Manon | People's Party of Canada | Defeated (unconfirmed) |
| Quebec | Ahuntsic-Cartierville | Duarte, Steven | Conservative Party of Canada | Defeated (unconfirmed) |
| Quebec | Ahuntsic-Cartierville | Joli-Coeur, Luc | Green Party of Canada | Defeated (unconfirmed) |
| Quebec | Ahuntsic-Cartierville | Joly, Hon. Mélanie | Liberal Party of Canada | Re-Elected (unconfirmed) |
| Quebec | Ahuntsic-Cartierville | Simonyan, Anna | Bloc Québécois | Defeated (unconfirmed) |
| Quebec | Alfred-Pellan | Cappelletti, Dwayne | Free Party Canada | Defeated (unconfirmed) |
| Quebec | Alfred-Pellan | Corneillet, Pierre-Alexandre | Green Party of Canada | Defeated (unconfirmed) |
| Quebec | Alfred-Pellan | D'Anello, Angiolino | Conservative Party of Canada | Defeated (unconfirmed) |
| Quebec | Alfred-Pellan | Dion, Isabel | Bloc Québécois | Defeated (unconfirmed) |
| Quebec | Alfred-Pellan | Iacono, Angelo | Liberal Party of Canada | Re-Elected (unconfirmed) |
| Quebec | Alfred-Pellan | Mercer, Cindy | New Democratic Party | Defeated (unconfirmed) |
| Quebec | Argenteuil—La Petite-Nation | Destroismaisons, Yves | Bloc Québécois | Defeated (unconfirmed) |
| Quebec | Argenteuil—La Petite-Nation | Lauzon, Stéphane | Liberal Party of Canada | Re-Elected (unconfirmed) |
| Quebec | Argenteuil—La Petite-Nation | Louis-Seize, Marie | Conservative Party of Canada | Defeated (unconfirmed) |
| Quebec | Argenteuil—La Petite-Nation | Lynes, Paul | Free Party Canada | Defeated (unconfirmed) |
| Quebec | Argenteuil—La Petite-Nation | Vachon, Marc | People's Party of Canada | Defeated (unconfirmed) |
| Quebec | Argenteuil—La Petite-Nation | Welt, Michel | New Democratic Party | Defeated (unconfirmed) |
| Quebec | Avignon—La Mitis—Matane—Matapédia | Barnabé, Éric | People's Party of Canada | Defeated (unconfirmed) |
| Quebec | Avignon—La Mitis—Matane—Matapédia | Dumas, Germain | Conservative Party of Canada | Defeated (unconfirmed) |
| Quebec | Avignon—La Mitis—Matane—Matapédia | Gendron, Mélanie | Free Party Canada | Defeated (unconfirmed) |
| Quebec | Avignon—La Mitis—Matane—Matapédia | Marchand, Christel | New Democratic Party | Defeated (unconfirmed) |
| Quebec | Avignon—La Mitis—Matane—Matapédia | Michaud, Kristina | Bloc Québécois | Re-Elected (unconfirmed) |
| Quebec | Avignon—La Mitis—Matane—Matapédia | Savoie, Louis-Éric | Liberal Party of Canada | Defeated (unconfirmed) |
| Quebec | Beauce | Bernier, Hon. Maxime | People's Party of Canada | Defeated (unconfirmed) |
| Quebec | Beauce | Giguere, Chantale | Free Party Canada | Defeated (unconfirmed) |
| Quebec | Beauce | Jacques-Côté, François | New Democratic Party | Defeated (unconfirmed) |
| Quebec | Beauce | Langlois, Philippe-Alexandre | Liberal Party of Canada | Defeated (unconfirmed) |
| Quebec | Beauce | Lehoux, Richard | Conservative Party of Canada | Re-Elected (unconfirmed) |
| Quebec | Beauce | Tanguay, Sébastien | Marijuana Party | Defeated (unconfirmed) |
| Quebec | Beauce | Thibodeau, Solange | Bloc Québécois | Defeated (unconfirmed) |
| Quebec | Beauce | Wisniowski, Andrzej | Green Party of Canada | Defeated (unconfirmed) |
| Quebec | Beauport—Côte-de-Beaupré—Île d'Orléans—Charlevoix | Amyot, Frédéric | Green Party of Canada | Defeated (unconfirmed) |
| Quebec | Beauport—Côte-de-Beaupré—Île d'Orléans—Charlevoix | Bernier, Alexandra | Liberal Party of Canada | Defeated (unconfirmed) |
| Quebec | Beauport—Côte-de-Beaupré—Île d'Orléans—Charlevoix | Desbiens, Caroline | Bloc Québécois | Re-Elected (unconfirmed) |
| Quebec | Beauport—Côte-de-Beaupré—Île d'Orléans—Charlevoix | Du Verle, Frédéric | New Democratic Party | Defeated (unconfirmed) |
| Quebec | Beauport—Côte-de-Beaupré—Île d'Orléans—Charlevoix | Laplante, Chantal | Free Party Canada | Defeated (unconfirmed) |
| Quebec | Beauport—Côte-de-Beaupré—Île d'Orléans—Charlevoix | Laprise, Véronique | Conservative Party of Canada | Defeated (unconfirmed) |
| Quebec | Beauport—Côte-de-Beaupré—Île d'Orléans—Charlevoix | Lefrançois, Louis (Jenniefer) | People's Party of Canada | Defeated (unconfirmed) |
| Quebec | Beauport—Côte-de-Beaupré—Île d'Orléans—Charlevoix | Lépine, Vicky | Independent | Defeated (unconfirmed) |
| Quebec | Beauport—Limoilou | Clarke, Alupa A. | Conservative Party of Canada | Defeated (unconfirmed) |
| Quebec | Beauport—Limoilou | Elhak, Dalila | Green Party of Canada | Defeated (unconfirmed) |
| Quebec | Beauport—Limoilou | Garon, Camille Esther | New Democratic Party | Defeated (unconfirmed) |
| Quebec | Beauport—Limoilou | Gingras, Ann | Liberal Party of Canada | Defeated (unconfirmed) |
| Quebec | Beauport—Limoilou | Moreau, Claude | Marxist-Leninist Party of Canada | Defeated (unconfirmed) |
| Quebec | Beauport—Limoilou | Verret, Lyne | Free Party Canada | Defeated (unconfirmed) |
| Quebec | Beauport—Limoilou | Vignola, Julie | Bloc Québécois | Re-Elected (unconfirmed) |
| Quebec | Bécancour—Nicolet—Saurel | Blanchette, André | Free Party Canada | Defeated (unconfirmed) |
| Quebec | Bécancour—Nicolet—Saurel | Caisse, Yanick | Conservative Party of Canada | Defeated (unconfirmed) |
| Quebec | Bécancour—Nicolet—Saurel | Gauvin, Catherine | New Democratic Party | Defeated (unconfirmed) |
| Quebec | Bécancour—Nicolet—Saurel | Pettersen, Eric | People's Party of Canada | Defeated (unconfirmed) |
| Quebec | Bécancour—Nicolet—Saurel | Plamondon, Louis | Bloc Québécois | Re-Elected (unconfirmed) |
| Quebec | Bécancour—Nicolet—Saurel | Rochefort, Nathalie | Liberal Party of Canada | Defeated (unconfirmed) |
| Quebec | Bécancour—Nicolet—Saurel | Turcotte, David | Green Party of Canada | Defeated (unconfirmed) |
| Quebec | Bellechasse—Les Etchemins—Lévis | Arcand, Raymond | Free Party Canada | Defeated (unconfirmed) |
| Quebec | Bellechasse—Les Etchemins—Lévis | Gagnon Gauthier, Marie-Philippe | New Democratic Party | Defeated (unconfirmed) |
| Quebec | Bellechasse—Les Etchemins—Lévis | Khuon, Chamroeun | Independent | Defeated (unconfirmed) |
| Quebec | Bellechasse—Les Etchemins—Lévis | Lefebvre, Hélène | Green Party of Canada | Defeated (unconfirmed) |
| Quebec | Bellechasse—Les Etchemins—Lévis | Richard, Marie-Christine | Bloc Québécois | Defeated (unconfirmed) |
| Quebec | Bellechasse—Les Etchemins—Lévis | Vaillancourt, Daniel | Liberal Party of Canada | Defeated (unconfirmed) |
| Quebec | Bellechasse—Les Etchemins—Lévis | Vien, Dominique | Conservative Party of Canada | Elected (unconfirmed) |
| Quebec | Beloeil—Chambly | Béliveau, Marie-Josée | New Democratic Party | Defeated (unconfirmed) |
| Quebec | Beloeil—Chambly | Blanchet, Yves-François | Bloc Québécois | Re-Elected (unconfirmed) |
| Quebec | Beloeil—Chambly | Blondin, Michel | Parti pour l'Indépendance du Québec | Defeated (unconfirmed) |
| Quebec | Beloeil—Chambly | Ejov, Danila | People's Party of Canada | Defeated (unconfirmed) |
| Quebec | Beloeil—Chambly | Gélinas Larrain, Fabrice | Green Party of Canada | Defeated (unconfirmed) |
| Quebec | Beloeil—Chambly | Grimard, Mario | Free Party Canada | Defeated (unconfirmed) |
| Quebec | Beloeil—Chambly | Hamel, Marie-Chantal | Liberal Party of Canada | Defeated (unconfirmed) |
| Quebec | Beloeil—Chambly | Robichaud, Stéphane | Conservative Party of Canada | Defeated (unconfirmed) |
| Quebec | Beloeil—Chambly | Thibault-Vincent, Thomas | Parti Rhinocéros Party | Defeated (unconfirmed) |
| Quebec | Beloeil—Chambly | Vachon, Benjamin | Marijuana Party | Defeated (unconfirmed) |
| Quebec | Berthier—Maskinongé | Bellemare, Alexandre | Liberal Party of Canada | Defeated (unconfirmed) |
| Quebec | Berthier—Maskinongé | Brosseau, Ruth Ellen | New Democratic Party | Defeated (unconfirmed) |
| Quebec | Berthier—Maskinongé | Brown, Denis | Free Party Canada | Defeated (unconfirmed) |
| Quebec | Berthier—Maskinongé | Lamirande, Steven | Marijuana Party | Defeated (unconfirmed) |
| Quebec | Berthier—Maskinongé | Perron, Yves | Bloc Québécois | Re-Elected (unconfirmed) |
| Quebec | Berthier—Maskinongé | Requilé, Laurence | Green Party of Canada | Defeated (unconfirmed) |
| Quebec | Berthier—Maskinongé | Sénécal, Geneviève | People's Party of Canada | Defeated (unconfirmed) |
| Quebec | Berthier—Maskinongé | Soulières, Léo | Conservative Party of Canada | Defeated (unconfirmed) |
| Quebec | Bourassa | Dia, Ardo | Bloc Québécois | Defeated (unconfirmed) |
| Quebec | Bourassa | Dubourg, Emmanuel | Liberal Party of Canada | Re-Elected (unconfirmed) |
| Quebec | Bourassa | Lavoie, Michel | People's Party of Canada | Defeated (unconfirmed) |
| Quebec | Bourassa | Perrone, Nathe | Green Party of Canada | Defeated (unconfirmed) |
| Quebec | Bourassa | Ponari, Nicholas | New Democratic Party | Defeated (unconfirmed) |
| Quebec | Bourassa | Prairie, Michel | Independent | Defeated (unconfirmed) |
| Quebec | Bourassa | Sykes, Ilyasa | Conservative Party of Canada | Defeated (unconfirmed) |
| Quebec | Brome—Missisquoi | Alarie, Marilou | Bloc Québécois | Defeated (unconfirmed) |
| Quebec | Brome—Missisquoi | Corcos, Michelle | Green Party of Canada | Defeated (unconfirmed) |
| Quebec | Brome—Missisquoi | Cotton, Lawrence | Veterans Coalition Party of Canada | Defeated (unconfirmed) |
| Quebec | Brome—Missisquoi | Desjardins, Dany | Independent | Defeated (unconfirmed) |
| Quebec | Brome—Missisquoi | Duhamel, Vincent | Conservative Party of Canada | Defeated (unconfirmed) |
| Quebec | Brome—Missisquoi | Lefebvre, Susanne | Christian Heritage Party of Canada | Defeated (unconfirmed) |
| Quebec | Brome—Missisquoi | Panton, Andrew | New Democratic Party | Defeated (unconfirmed) |
| Quebec | Brome—Missisquoi | Richard, Maryse | Free Party Canada | Defeated (unconfirmed) |
| Quebec | Brome—Missisquoi | St-Onge, Pascale | Liberal Party of Canada | Elected (unconfirmed) |
| Quebec | Brome—Missisquoi | Stogowski, Alexis | People's Party of Canada | Defeated (unconfirmed) |
| Quebec | Brossard—Saint-Lambert | Alves, Marcos | Conservative Party of Canada | Defeated (unconfirmed) |
| Quebec | Brossard—Saint-Lambert | Audet, Marc | New Democratic Party | Defeated (unconfirmed) |
| Quebec | Brossard—Saint-Lambert | Desgagné, Marie-Laurence | Bloc Québécois | Defeated (unconfirmed) |
| Quebec | Brossard—Saint-Lambert | Hu, Fang | Free Party Canada | Defeated (unconfirmed) |
| Quebec | Brossard—Saint-Lambert | Mendès, Alexandra | Liberal Party of Canada | Re-Elected (unconfirmed) |
| Quebec | Brossard—Saint-Lambert | Ross, Brenda | People's Party of Canada | Defeated (unconfirmed) |
| Quebec | Charlesbourg—Haute-Saint-Charles | Coly, René-Paul | Liberal Party of Canada | Defeated (unconfirmed) |
| Quebec | Charlesbourg—Haute-Saint-Charles | Cyr, Wayne | People's Party of Canada | Defeated (unconfirmed) |
| Quebec | Charlesbourg—Haute-Saint-Charles | Lacroix, Michel Marc | New Democratic Party | Defeated (unconfirmed) |
| Quebec | Charlesbourg—Haute-Saint-Charles | Lamontagne, Marie-Christine | Bloc Québécois | Defeated (unconfirmed) |
| Quebec | Charlesbourg—Haute-Saint-Charles | Palardy-Dion, Jacques | Green Party of Canada | Defeated (unconfirmed) |
| Quebec | Charlesbourg—Haute-Saint-Charles | Paul-Hus, Pierre | Conservative Party of Canada | Re-Elected (unconfirmed) |
| Quebec | Charlesbourg—Haute-Saint-Charles | Pelletier, Daniel | Free Party Canada | Defeated (unconfirmed) |
| Quebec | Châteauguay—Lacolle | Benoit, Jeff | People's Party of Canada | Defeated (unconfirmed) |
| Quebec | Châteauguay—Lacolle | Bournaki, Pierre | Conservative Party of Canada | Defeated (unconfirmed) |
| Quebec | Châteauguay—Lacolle | Gagnon, Marc | Parti pour l'Indépendance du Québec | Defeated (unconfirmed) |
| Quebec | Châteauguay—Lacolle | Lafrance, André | Free Party Canada | Defeated (unconfirmed) |
| Quebec | Châteauguay—Lacolle | O'Hara, Patrick | Bloc Québécois | Elected (unconfirmed) |
| Quebec | Châteauguay—Lacolle | Olivier, Frédéric | Green Party of Canada | Defeated (unconfirmed) |
| Quebec | Châteauguay—Lacolle | Shanahan, Brenda | Liberal Party of Canada | Defeated (unconfirmed) |
| Quebec | Châteauguay—Lacolle | Wolker, Hannah | New Democratic Party | Defeated (unconfirmed) |
| Quebec | Chicoutimi—Le Fjord | Bouchard, Julie | Bloc Québécois | Defeated (unconfirmed) |
| Quebec | Chicoutimi—Le Fjord | Duplain, Jean | Liberal Party of Canada | Defeated (unconfirmed) |
| Quebec | Chicoutimi—Le Fjord | Laporte, Yves | Green Party of Canada | Defeated (unconfirmed) |
| Quebec | Chicoutimi—Le Fjord | Martel, Richard | Conservative Party of Canada | Re-Elected (unconfirmed) |
| Quebec | Chicoutimi—Le Fjord | Raymond, Ismaël | New Democratic Party | Defeated (unconfirmed) |
| Quebec | Chicoutimi—Le Fjord | Voyer, Jimmy | People's Party of Canada | Defeated (unconfirmed) |
| Quebec | Compton—Stanstead | Allen, Geneva | New Democratic Party | Defeated (unconfirmed) |
| Quebec | Compton—Stanstead | Bibeau, Hon. Marie-Claude | Liberal Party of Canada | Re-Elected (unconfirmed) |
| Quebec | Compton—Stanstead | Bourassa, Yves | People's Party of Canada | Defeated (unconfirmed) |
| Quebec | Compton—Stanstead | Bresse, Nathalie | Bloc Québécois | Defeated (unconfirmed) |
| Quebec | Compton—Stanstead | Dodier, Sylvain | Green Party of Canada | Defeated (unconfirmed) |
| Quebec | Compton—Stanstead | Gendron, Déitane | Free Party Canada | Defeated (unconfirmed) |
| Quebec | Compton—Stanstead | Longpré, Sylvain | Independent | Defeated (unconfirmed) |
| Quebec | Compton—Stanstead | Tremblay, Pierre | Conservative Party of Canada | Defeated (unconfirmed) |
| Quebec | Dorval—Lachine—LaSalle | Bazelais, Jude | Conservative Party of Canada | Defeated (unconfirmed) |
| Quebec | Dorval—Lachine—LaSalle | Dhillon, Anju | Liberal Party of Canada | Re-Elected (unconfirmed) |
| Quebec | Dorval—Lachine—LaSalle | Jenneau, Cloé Rose | Bloc Québécois | Defeated (unconfirmed) |
| Quebec | Dorval—Lachine—LaSalle | Mariani, Laura | Green Party of Canada | Defeated (unconfirmed) |
| Quebec | Dorval—Lachine—LaSalle | Ngamaleu Teumeni, Fabiola | New Democratic Party | Defeated (unconfirmed) |
| Quebec | Dorval—Lachine—LaSalle | Patterson, Michael | People's Party of Canada | Defeated (unconfirmed) |
| Quebec | Drummond | Berri, Mustapha | Liberal Party of Canada | Defeated (unconfirmed) |
| Quebec | Drummond | Champoux, Martin | Bloc Québécois | Re-Elected (unconfirmed) |
| Quebec | Drummond | Choquette, François | New Democratic Party | Defeated (unconfirmed) |
| Quebec | Drummond | Clermont, Nathalie | Conservative Party of Canada | Defeated (unconfirmed) |
| Quebec | Drummond | Joyal, Josée | Free Party Canada | Defeated (unconfirmed) |
| Quebec | Drummond | Marcoux, Sylvain | No Affiliation | Defeated (unconfirmed) |
| Quebec | Drummond | Munger, Lucas | Animal Protection Party of Canada | Defeated (unconfirmed) |
| Quebec | Gaspésie—Les Îles-de-la-Madeleine | Bernatchez, Guy | Bloc Québécois | Defeated (unconfirmed) |
| Quebec | Gaspésie—Les Îles-de-la-Madeleine | Lebouthillier, Hon. Diane | Liberal Party of Canada | Re-Elected (unconfirmed) |
| Quebec | Gaspésie—Les Îles-de-la-Madeleine | Leduc, Monique | Free Party Canada | Defeated (unconfirmed) |
| Quebec | Gaspésie—Les Îles-de-la-Madeleine | Phung, Lisa | New Democratic Party | Defeated (unconfirmed) |
| Quebec | Gaspésie—Les Îles-de-la-Madeleine | Pigeon, Jean-Pierre | Conservative Party of Canada | Defeated (unconfirmed) |
| Quebec | Gaspésie—Les Îles-de-la-Madeleine | Rioux, Christian | People's Party of Canada | Defeated (unconfirmed) |
| Quebec | Gatineau | Bernard, Joel E. | Conservative Party of Canada | Defeated (unconfirmed) |
| Quebec | Gatineau | Gendron-Nadeau, Geneviève | Bloc Québécois | Defeated (unconfirmed) |
| Quebec | Gatineau | Grenier, Sébastien | Parti Rhinocéros Party | Defeated (unconfirmed) |
| Quebec | Gatineau | Jemmah, Rachid | Green Party of Canada | Defeated (unconfirmed) |
| Quebec | Gatineau | Lavoie, Luc | Free Party Canada | Defeated (unconfirmed) |
| Quebec | Gatineau | MacKinnon, Steven | Liberal Party of Canada | Re-Elected (unconfirmed) |
| Quebec | Gatineau | Rengel, Fernanda | New Democratic Party | Defeated (unconfirmed) |
| Quebec | Gatineau | Saint-Jean, Mathieu | People's Party of Canada | Defeated (unconfirmed) |
| Quebec | Gatineau | Soublière, Pierre | Marxist-Leninist Party of Canada | Defeated (unconfirmed) |
| Quebec | Hochelaga | Calle Cabrera, Aime | Conservative Party of Canada | Defeated (unconfirmed) |
| Quebec | Hochelaga | Dandenault, Christine | Marxist-Leninist Party of Canada | Defeated (unconfirmed) |
| Quebec | Hochelaga | Doucet-Beauchamp, Marc-André | People's Party of Canada | Defeated (unconfirmed) |
| Quebec | Hochelaga | Lavarenne, Zachary | Green Party of Canada | Defeated (unconfirmed) |
| Quebec | Hochelaga | Marchand, Simon | Bloc Québécois | Defeated (unconfirmed) |
| Quebec | Hochelaga | Martinez Ferrada, Soraya | Liberal Party of Canada | Re-Elected (unconfirmed) |
| Quebec | Hochelaga | Paquette, Michelle | Communist Party of Canada | Defeated (unconfirmed) |
| Quebec | Hochelaga | Poulin, Denis | Parti Rhinocéros Party | Defeated (unconfirmed) |
| Quebec | Hochelaga | Roy-Goyette, Catherine | New Democratic Party | Defeated (unconfirmed) |
| Quebec | Honoré-Mercier | Ayala, Paulina | New Democratic Party | Defeated (unconfirmed) |
| Quebec | Honoré-Mercier | Croteau, Guy | Conservative Party of Canada | Defeated (unconfirmed) |
| Quebec | Honoré-Mercier | Deltorto-Russell, Bianca | Green Party of Canada | Defeated (unconfirmed) |
| Quebec | Honoré-Mercier | Le Seigle, Yves | Marxist-Leninist Party of Canada | Defeated (unconfirmed) |
| Quebec | Honoré-Mercier | Lévesque-Marin, Charlotte | Bloc Québécois | Defeated (unconfirmed) |
| Quebec | Honoré-Mercier | Miranda, Lucilia | People's Party of Canada | Defeated (unconfirmed) |
| Quebec | Honoré-Mercier | Rodriguez, Hon. Pablo | Liberal Party of Canada | Re-Elected (unconfirmed) |
| Quebec | Hull—Aylmer | Dickins, Catherine | Independent | Defeated (unconfirmed) |
| Quebec | Hull—Aylmer | Fergus, Greg | Liberal Party of Canada | Re-Elected (unconfirmed) |
| Quebec | Hull—Aylmer | Fleury, Eric | People's Party of Canada | Defeated (unconfirmed) |
| Quebec | Hull—Aylmer | Gendron, Samuel | New Democratic Party | Defeated (unconfirmed) |
| Quebec | Hull—Aylmer | Gnocchini-Messier, Simon | Green Party of Canada | Defeated (unconfirmed) |
| Quebec | Hull—Aylmer | Lafleur, Josée | Free Party Canada | Defeated (unconfirmed) |
| Quebec | Hull—Aylmer | LeBlanc, Micheal | Parti Rhinocéros Party | Defeated (unconfirmed) |
| Quebec | Hull—Aylmer | Perion, Sandrine | Conservative Party of Canada | Defeated (unconfirmed) |
| Quebec | Hull—Aylmer | Provost, Simon | Bloc Québécois | Defeated (unconfirmed) |
| Quebec | Joliette | Beaudet, Alexis | New Democratic Party | Defeated (unconfirmed) |
| Quebec | Joliette | Bourgeois, Michel | Liberal Party of Canada | Defeated (unconfirmed) |
| Quebec | Joliette | Claude Théoret, Yanick | Marijuana Party | Defeated (unconfirmed) |
| Quebec | Joliette | Coutu, Manon | Free Party Canada | Defeated (unconfirmed) |
| Quebec | Joliette | Leclerc, Maxime | People's Party of Canada | Defeated (unconfirmed) |
| Quebec | Joliette | Materne, Roger | Conservative Party of Canada | Defeated (unconfirmed) |
| Quebec | Joliette | Poirier, Érica | Green Party of Canada | Defeated (unconfirmed) |
| Quebec | Joliette | Ste-Marie, Gabriel | Bloc Québécois | Re-Elected (unconfirmed) |
| Quebec | Jonquière | Bégin, Stéphane | Liberal Party of Canada | Defeated (unconfirmed) |
| Quebec | Jonquière | Bélanger, Line | Parti Rhinocéros Party | Defeated (unconfirmed) |
| Quebec | Jonquière | Gravel, Louise | Conservative Party of Canada | Defeated (unconfirmed) |
| Quebec | Jonquière | Ruel, Marie-Eve | New Democratic Party | Defeated (unconfirmed) |
| Quebec | Jonquière | Simard, Mario | Bloc Québécois | Re-Elected (unconfirmed) |
| Quebec | Jonquière | Yelle, Marie-Josée | Green Party of Canada | Defeated (unconfirmed) |
| Quebec | La Pointe-de-l'Île | Anania, Massimo | Conservative Party of Canada | Defeated (unconfirmed) |
| Quebec | La Pointe-de-l'Île | Beaulieu, Mario | Bloc Québécois | Re-Elected (unconfirmed) |
| Quebec | La Pointe-de-l'Île | Desclin, Jonathan | People's Party of Canada | Defeated (unconfirmed) |
| Quebec | La Pointe-de-l'Île | Fadeu, Jonas | Liberal Party of Canada | Defeated (unconfirmed) |
| Quebec | La Pointe-de-l'Île | Falquet, Agnès | Free Party Canada | Defeated (unconfirmed) |
| Quebec | La Pointe-de-l'Île | Gervais, Charles Phillippe | Parti pour l'Indépendance du Québec | Defeated (unconfirmed) |
| Quebec | La Pointe-de-l'Île | Royer, Geneviève | Marxist-Leninist Party of Canada | Defeated (unconfirmed) |
| Quebec | La Pointe-de-l'Île | Vallerand, Alexandre | New Democratic Party | Defeated (unconfirmed) |
| Quebec | La Prairie | Chouinard, Normand | Marxist-Leninist Party of Canada | Defeated (unconfirmed) |
| Quebec | La Prairie | des Greniers, Lise | Conservative Party of Canada | Defeated (unconfirmed) |
| Quebec | La Prairie | Desrochers, Caroline | Liberal Party of Canada | Defeated (unconfirmed) |
| Quebec | La Prairie | Fontaine, Ruth | People's Party of Canada | Defeated (unconfirmed) |
| Quebec | La Prairie | Hernandez Garcia, Lourdes Victoria | New Democratic Party | Defeated (unconfirmed) |
| Quebec | La Prairie | Joannette, Barbara | Green Party of Canada | Defeated (unconfirmed) |
| Quebec | La Prairie | Therrien, Alain | Bloc Québécois | Re-Elected (unconfirmed) |
| Quebec | Lac-Saint-Jean | Bergeron, Serge | Conservative Party of Canada | Defeated (unconfirmed) |
| Quebec | Lac-Saint-Jean | Brunelle-Duceppe, Alexis | Bloc Québécois | Re-Elected (unconfirmed) |
| Quebec | Lac-Saint-Jean | Chambers, Mathieu | New Democratic Party | Defeated (unconfirmed) |
| Quebec | Lac-Saint-Jean | Étienne, Marjolaine | Liberal Party of Canada | Defeated (unconfirmed) |
| Quebec | Lac-Saint-Jean | Thibault, Annie | Green Party of Canada | Defeated (unconfirmed) |
| Quebec | Lac-Saint-Louis | Francis, Ann | Conservative Party of Canada | Defeated (unconfirmed) |
| Quebec | Lac-Saint-Louis | Gray, Jonathan | New Democratic Party | Defeated (unconfirmed) |
| Quebec | Lac-Saint-Louis | Kona-Mancini, Milan | Green Party of Canada | Defeated (unconfirmed) |
| Quebec | Lac-Saint-Louis | Lassy-Lotahe, Afia | People's Party of Canada | Defeated (unconfirmed) |
| Quebec | Lac-Saint-Louis | Lebeuf, Rémi | Bloc Québécois | Defeated (unconfirmed) |
| Quebec | Lac-Saint-Louis | Scarpaleggia, Francis | Liberal Party of Canada | Re-Elected (unconfirmed) |
| Quebec | LaSalle—Émard—Verdun | Antonin, Pascal | Free Party Canada | Defeated (unconfirmed) |
| Quebec | LaSalle—Émard—Verdun | Carter, Sarah | Green Party of Canada | Defeated (unconfirmed) |
| Quebec | LaSalle—Émard—Verdun | De Lierre, Jason | New Democratic Party | Defeated (unconfirmed) |
| Quebec | LaSalle—Émard—Verdun | Fortin, Jean-Philippe | Communist Party of Canada | Defeated (unconfirmed) |
| Quebec | LaSalle—Émard—Verdun | Guérard, Raphaël | Bloc Québécois | Defeated (unconfirmed) |
| Quebec | LaSalle—Émard—Verdun | Lametti, Hon. David | Liberal Party of Canada | Re-Elected (unconfirmed) |
| Quebec | LaSalle—Émard—Verdun | Moran, Janina | Conservative Party of Canada | Defeated (unconfirmed) |
| Quebec | LaSalle—Émard—Verdun | Walsh, Michel | People's Party of Canada | Defeated (unconfirmed) |
| Quebec | Laurentides—Labelle | Baland, Eric-Abel | New Democratic Party | Defeated (unconfirmed) |
| Quebec | Laurentides—Labelle | Evanko, Richard | People's Party of Canada | Defeated (unconfirmed) |
| Quebec | Laurentides—Labelle | Gaudreau, Marie-Hélène | Bloc Québécois | Re-Elected (unconfirmed) |
| Quebec | Laurentides—Labelle | Laframboise, Kathy | Conservative Party of Canada | Defeated (unconfirmed) |
| Quebec | Laurentides—Labelle | Le Comte, Michel | Green Party of Canada | Defeated (unconfirmed) |
| Quebec | Laurentides—Labelle | Leclerc, Michel | Free Party Canada | Defeated (unconfirmed) |
| Quebec | Laurentides—Labelle | Menassa, Antoine | Liberal Party of Canada | Defeated (unconfirmed) |
| Quebec | Laurentides—Labelle | Sorel, Jean-Noël | Independent | Defeated (unconfirmed) |
| Quebec | Laurier—Sainte-Marie | Guilbeault, Hon. Steven | Liberal Party of Canada | Re-Elected (unconfirmed) |
| Quebec | Laurier—Sainte-Marie | Julien, Cyril | Independent | Defeated (unconfirmed) |
| Quebec | Laurier—Sainte-Marie | Lachapelle, Serge | Marxist-Leninist Party of Canada | Defeated (unconfirmed) |
| Quebec | Laurier—Sainte-Marie | Lamontagne, Kimberly | Animal Protection Party of Canada | Defeated (unconfirmed) |
| Quebec | Laurier—Sainte-Marie | Lavarenne, Jean-Michel | Green Party of Canada | Defeated (unconfirmed) |
| Quebec | Laurier—Sainte-Marie | Machouf, Nimâ | New Democratic Party | Defeated (unconfirmed) |
| Quebec | Laurier—Sainte-Marie | Michel, Marie-Eve-Lyne | Bloc Québécois | Defeated (unconfirmed) |
| Quebec | Laurier—Sainte-Marie | Morin, Julie | Free Party Canada | Defeated (unconfirmed) |
| Quebec | Laurier—Sainte-Marie | Reich, Ronan | Conservative Party of Canada | Defeated (unconfirmed) |
| Quebec | Laurier—Sainte-Marie | Tanguay, Daniel | People's Party of Canada | Defeated (unconfirmed) |
| Quebec | Laurier—Sainte-Marie | Welsh, Adrien | Communist Party of Canada | Defeated (unconfirmed) |
| Quebec | Laval—Les Îles | Couture, Matthieu | People's Party of Canada | Defeated (unconfirmed) |
| Quebec | Laval—Les Îles | El-Khoury, Fayçal | Liberal Party of Canada | Re-Elected (unconfirmed) |
| Quebec | Laval—Les Îles | Jolivet, Guillaume | Bloc Québécois | Defeated (unconfirmed) |
| Quebec | Laval—Les Îles | Pettas, Spyridonas | Conservative Party of Canada | Defeated (unconfirmed) |
| Quebec | Laval—Les Îles | Taleb, Ahmed | Green Party of Canada | Defeated (unconfirmed) |
| Quebec | Laval—Les Îles | Woodmass, Rowan | New Democratic Party | Defeated (unconfirmed) |
| Quebec | Lévis—Lotbinière | Bergeron, Charles-Eugène | Green Party of Canada | Defeated (unconfirmed) |
| Quebec | Lévis—Lotbinière | Brochu, Carl | Parti Patriote | Defeated (unconfirmed) |
| Quebec | Lévis—Lotbinière | Daigle, Ghislain | Liberal Party of Canada | Defeated (unconfirmed) |
| Quebec | Lévis—Lotbinière | Dumont, Guylaine | New Democratic Party | Defeated (unconfirmed) |
| Quebec | Lévis—Lotbinière | Gourde, Jacques | Conservative Party of Canada | Re-Elected (unconfirmed) |
| Quebec | Lévis—Lotbinière | Lamarche, Samuel | Bloc Québécois | Defeated (unconfirmed) |
| Quebec | Lévis—Lotbinière | Lemay, Mariève | Free Party Canada | Defeated (unconfirmed) |
| Quebec | Lévis—Lotbinière | Simard, Benoit | People's Party of Canada | Defeated (unconfirmed) |
| Quebec | Longueuil—Charles-LeMoyne | Boisclair, Nathalie | Bloc Québécois | Defeated (unconfirmed) |
| Quebec | Longueuil—Charles-LeMoyne | Cardin, Nancy | Green Party of Canada | Defeated (unconfirmed) |
| Quebec | Longueuil—Charles-LeMoyne | Chénier, Pierre | Marxist-Leninist Party of Canada | Defeated (unconfirmed) |
| Quebec | Longueuil—Charles-LeMoyne | Dhatsenpa, Kalden | New Democratic Party | Defeated (unconfirmed) |
| Quebec | Longueuil—Charles-LeMoyne | Lalonde, Isabelle | Conservative Party of Canada | Defeated (unconfirmed) |
| Quebec | Longueuil—Charles-LeMoyne | Olinga, Jephte Tiny | People's Party of Canada | Defeated (unconfirmed) |
| Quebec | Longueuil—Charles-LeMoyne | Romanado, Sherry | Liberal Party of Canada | Re-Elected (unconfirmed) |
| Quebec | Longueuil—Saint-Hubert | Gagnon, Florence | Liberal Party of Canada | Defeated (unconfirmed) |
| Quebec | Longueuil—Saint-Hubert | Girard, Manon | People's Party of Canada | Defeated (unconfirmed) |
| Quebec | Longueuil—Saint-Hubert | King, Simon | Green Party of Canada | Defeated (unconfirmed) |
| Quebec | Longueuil—Saint-Hubert | Lafrenaye, Jacinthe | Parti pour l'Indépendance du Québec | Defeated (unconfirmed) |
| Quebec | Longueuil—Saint-Hubert | Murray, Mildred | New Democratic Party | Defeated (unconfirmed) |
| Quebec | Longueuil—Saint-Hubert | Tall, Boukare | Conservative Party of Canada | Defeated (unconfirmed) |
| Quebec | Longueuil—Saint-Hubert | Trudel, Denis | Bloc Québécois | Re-Elected (unconfirmed) |
| Quebec | Louis-Hébert | Blanchette, Denis | Green Party of Canada | Defeated (unconfirmed) |
| Quebec | Louis-Hébert | Dahan, Ali | Independent | Defeated (unconfirmed) |
| Quebec | Louis-Hébert | Dean, Marc | Bloc Québécois | Defeated (unconfirmed) |
| Quebec | Louis-Hébert | Lépine, Gilles | Conservative Party of Canada | Defeated (unconfirmed) |
| Quebec | Louis-Hébert | Lightbound, Joël | Liberal Party of Canada | Re-Elected (unconfirmed) |
| Quebec | Louis-Hébert | Nadji, Hamid | New Democratic Party | Defeated (unconfirmed) |
| Quebec | Louis-Saint-Laurent | Bilodeau, Thierry | Bloc Québécois | Defeated (unconfirmed) |
| Quebec | Louis-Saint-Laurent | Chicoine, Daniel | Green Party of Canada | Defeated (unconfirmed) |
| Quebec | Louis-Saint-Laurent | Côté, Guillaume | People's Party of Canada | Defeated (unconfirmed) |
| Quebec | Louis-Saint-Laurent | Deltell, Gérard | Conservative Party of Canada | Re-Elected (unconfirmed) |
| Quebec | Louis-Saint-Laurent | Fortin, Mélanie | Free Party Canada | Defeated (unconfirmed) |
| Quebec | Louis-Saint-Laurent | Huang, Yu-Ti | New Democratic Party | Defeated (unconfirmed) |
| Quebec | Louis-Saint-Laurent | Morin, Nathaniel | Liberal Party of Canada | Defeated (unconfirmed) |
| Quebec | Manicouagan | Gagné, Thomas | Liberal Party of Canada | Defeated (unconfirmed) |
| Quebec | Manicouagan | Gill, Marilène | Bloc Québécois | Re-Elected (unconfirmed) |
| Quebec | Manicouagan | Girard, Bianca | Free Party Canada | Defeated (unconfirmed) |
| Quebec | Manicouagan | St-Jean, Nichola | New Democratic Party | Defeated (unconfirmed) |
| Quebec | Manicouagan | Vigneault, Rodrigue | Conservative Party of Canada | Defeated (unconfirmed) |
| Quebec | Marc-Aurèle-Fortin | Faour, Ali | New Democratic Party | Defeated (unconfirmed) |
| Quebec | Marc-Aurèle-Fortin | Flibotte, Micheline | Free Party Canada | Defeated (unconfirmed) |
| Quebec | Marc-Aurèle-Fortin | Lacharité, Manon D. | Bloc Québécois | Defeated (unconfirmed) |
| Quebec | Marc-Aurèle-Fortin | Léger, Louis | People's Party of Canada | Defeated (unconfirmed) |
| Quebec | Marc-Aurèle-Fortin | Petrari, Sarah | Conservative Party of Canada | Defeated (unconfirmed) |
| Quebec | Marc-Aurèle-Fortin | Robillard, Yves | Liberal Party of Canada | Re-Elected (unconfirmed) |
| Quebec | Mégantic—L'Érable | Berthold, Luc | Conservative Party of Canada | Re-Elected (unconfirmed) |
| Quebec | Mégantic—L'Érable | Blais, Gloriane | Independent | Defeated (unconfirmed) |
| Quebec | Mégantic—L'Érable | Boisvert, Mathieu | New Democratic Party | Defeated (unconfirmed) |
| Quebec | Mégantic—L'Érable | Gagnon, Jonathan | People's Party of Canada | Defeated (unconfirmed) |
| Quebec | Mégantic—L'Érable | Hamel, Emilie | Green Party of Canada | Defeated (unconfirmed) |
| Quebec | Mégantic—L'Érable | Labonté, Éric | Bloc Québécois | Defeated (unconfirmed) |
| Quebec | Mégantic—L'Érable | Lukofsky, Adam | Liberal Party of Canada | Defeated (unconfirmed) |
| Quebec | Mégantic—L'Érable | Pepin, Real | Free Party Canada | Defeated (unconfirmed) |
| Quebec | Mirabel | Bourassa, Benoit | New Democratic Party | Defeated (unconfirmed) |
| Quebec | Mirabel | Croteau, Ariane | Free Party Canada | Defeated (unconfirmed) |
| Quebec | Mirabel | Garon, Jean-Denis | Bloc Québécois | Elected (unconfirmed) |
| Quebec | Mirabel | Guay, Mario | Green Party of Canada | Defeated (unconfirmed) |
| Quebec | Mirabel | Lefebvre, Catherine | Conservative Party of Canada | Defeated (unconfirmed) |
| Quebec | Mirabel | Loza, François | Liberal Party of Canada | Defeated (unconfirmed) |
| Quebec | Mirabel | Montpetit, Christian | People's Party of Canada | Defeated (unconfirmed) |
| Quebec | Montarville | Bergeron, Stéphane | Bloc Québécois | Re-Elected (unconfirmed) |
| Quebec | Montarville | Hynes, Natasha | People's Party of Canada | Defeated (unconfirmed) |
| Quebec | Montarville | Pelchat, Marie-Ève | Liberal Party of Canada | Defeated (unconfirmed) |
| Quebec | Montarville | Sauvageau, Julie | Conservative Party of Canada | Defeated (unconfirmed) |
| Quebec | Montarville | Sellah, Djaouida | New Democratic Party | Defeated (unconfirmed) |
| Quebec | Montcalm | Beaudry, Bruno | People's Party of Canada | Defeated (unconfirmed) |
| Quebec | Montcalm | Bellerose, Robert | Free Party Canada | Defeated (unconfirmed) |
| Quebec | Montcalm | DesRoches, Gisèle | Conservative Party of Canada | Defeated (unconfirmed) |
| Quebec | Montcalm | Goué, Oulai B. | New Democratic Party | Defeated (unconfirmed) |
| Quebec | Montcalm | Goyette, Mathieu | Green Party of Canada | Defeated (unconfirmed) |
| Quebec | Montcalm | Qureshi, Javeria | Liberal Party of Canada | Defeated (unconfirmed) |
| Quebec | Montcalm | Thériault, Luc | Bloc Québécois | Re-Elected (unconfirmed) |
| Quebec | Montmagny—L'Islet—Kamouraska—Rivière-du-Loup | Bérubé, Simon | Bloc Québécois | Defeated (unconfirmed) |
| Quebec | Montmagny—L'Islet—Kamouraska—Rivière-du-Loup | English, Sean | New Democratic Party | Defeated (unconfirmed) |
| Quebec | Montmagny—L'Islet—Kamouraska—Rivière-du-Loup | Généreux, Bernard | Conservative Party of Canada | Re-Elected (unconfirmed) |
| Quebec | Montmagny—L'Islet—Kamouraska—Rivière-du-Loup | Lapointe, François | Liberal Party of Canada | Defeated (unconfirmed) |
| Quebec | Montmagny—L'Islet—Kamouraska—Rivière-du-Loup | Mony, Thibaud | Parti Rhinocéros Party | Defeated (unconfirmed) |
| Quebec | Montmagny—L'Islet—Kamouraska—Rivière-du-Loup | Rochon, Nancy | Free Party Canada | Defeated (unconfirmed) |
| Quebec | Mount Royal | Badra, Clément | Green Party of Canada | Defeated (unconfirmed) |
| Quebec | Mount Royal | Cavallaro, Franco | Conservative Party of Canada | Defeated (unconfirmed) |
| Quebec | Mount Royal | El-Khoury, Bruno Ibrahim | New Democratic Party | Defeated (unconfirmed) |
| Quebec | Mount Royal | Housefather, Anthony | Liberal Party of Canada | Re-Elected (unconfirmed) |
| Quebec | Mount Royal | Johnston, Diane | Marxist-Leninist Party of Canada | Defeated (unconfirmed) |
| Quebec | Mount Royal | Komarov, Yegor | Bloc Québécois | Defeated (unconfirmed) |
| Quebec | Mount Royal | Lozoff, Zachary | People's Party of Canada | Defeated (unconfirmed) |
| Quebec | Notre-Dame-de-Grâce—Westmount | Craig Larouche, Jordan | Bloc Québécois | Defeated (unconfirmed) |
| Quebec | Notre-Dame-de-Grâce—Westmount | Elbourne-Weinstock, Emma | New Democratic Party | Defeated (unconfirmed) |
| Quebec | Notre-Dame-de-Grâce—Westmount | Fairbrother, Sam | Green Party of Canada | Defeated (unconfirmed) |
| Quebec | Notre-Dame-de-Grâce—Westmount | Freiheit, David | People's Party of Canada | Defeated (unconfirmed) |
| Quebec | Notre-Dame-de-Grâce—Westmount | Garneau, Hon. Marc | Liberal Party of Canada | Re-Elected (unconfirmed) |
| Quebec | Notre-Dame-de-Grâce—Westmount | Hoffman, Rachel | Marxist-Leninist Party of Canada | Defeated (unconfirmed) |
| Quebec | Notre-Dame-de-Grâce—Westmount | Levitsky-Kaminski, Mathew | Conservative Party of Canada | Defeated (unconfirmed) |
| Quebec | Notre-Dame-de-Grâce—Westmount | Wandji, Geofryde | Christian Heritage Party of Canada | Defeated (unconfirmed) |
| Quebec | Outremont | Bendayan, Rachel | Liberal Party of Canada | Re-Elected (unconfirmed) |
| Quebec | Outremont | Grimard, Célia | Bloc Québécois | Defeated (unconfirmed) |
| Quebec | Outremont | Joshi, Angela | Independent | Defeated (unconfirmed) |
| Quebec | Outremont | Louras, Jasmine | Conservative Party of Canada | Defeated (unconfirmed) |
| Quebec | Outremont | Péclet, Ève | New Democratic Party | Defeated (unconfirmed) |
| Quebec | Outremont | Pinto, Yehuda | People's Party of Canada | Defeated (unconfirmed) |
| Quebec | Outremont | Tarabey, Grace | Green Party of Canada | Defeated (unconfirmed) |
| Quebec | Papineau | Ben Youssef, Nabila | Bloc Québécois | Defeated (unconfirmed) |
| Quebec | Papineau | Boutin, Christian | People's Party of Canada | Defeated (unconfirmed) |
| Quebec | Papineau | Colly, Garnet | Marxist-Leninist Party of Canada | Defeated (unconfirmed) |
| Quebec | Papineau | Lepine, Alain | Green Party of Canada | Defeated (unconfirmed) |
| Quebec | Papineau | Martin, Raymond | Independent | Defeated (unconfirmed) |
| Quebec | Papineau | Paré, Christine | New Democratic Party | Defeated (unconfirmed) |
| Quebec | Papineau | Rivera, Julio | Conservative Party of Canada | Defeated (unconfirmed) |
| Quebec | Papineau | Trudeau, Right Hon. Justin | Liberal Party of Canada | Re-Elected (unconfirmed) |
| Quebec | Papineau | Zako, Béatrice | Independent | Defeated (unconfirmed) |
| Quebec | Papineau | Znoneofthe, Above | Parti Rhinocéros Party | Defeated (unconfirmed) |
| Quebec | Pierre-Boucher—Les Patriotes—Verchères | Barsalou-Duval, Xavier | Bloc Québécois | Re-Elected (unconfirmed) |
| Quebec | Pierre-Boucher—Les Patriotes—Verchères | Blais, Alexandre | People's Party of Canada | Defeated (unconfirmed) |
| Quebec | Pierre-Boucher—Les Patriotes—Verchères | Boisvert, Carole | Free Party Canada | Defeated (unconfirmed) |
| Quebec | Pierre-Boucher—Les Patriotes—Verchères | Girard, Louis-Gabriel | Liberal Party of Canada | Defeated (unconfirmed) |
| Quebec | Pierre-Boucher—Les Patriotes—Verchères | Leprohon, Martin | New Democratic Party | Defeated (unconfirmed) |
| Quebec | Pierre-Boucher—Les Patriotes—Verchères | Painchaud, Jérôme | Conservative Party of Canada | Defeated (unconfirmed) |
| Quebec | Pierrefonds—Dollard | Bourque, Nadia | Bloc Québécois | Defeated (unconfirmed) |
| Quebec | Pierrefonds—Dollard | Roberts, Terence Brian | Conservative Party of Canada | Defeated (unconfirmed) |
| Quebec | Pierrefonds—Dollard | Sibthorpe, Mark | People's Party of Canada | Defeated (unconfirmed) |
| Quebec | Pierrefonds—Dollard | Tumbar, Maninderjit Kaur | New Democratic Party | Defeated (unconfirmed) |
| Quebec | Pierrefonds—Dollard | Zuberi, Sameer | Liberal Party of Canada | Re-Elected (unconfirmed) |
| Quebec | Pontiac | Chatel, Sophie | Liberal Party of Canada | Elected (unconfirmed) |
| Quebec | Pontiac | Desjardins, Gabrielle | Bloc Québécois | Defeated (unconfirmed) |
| Quebec | Pontiac | Gauthier, Michel | Conservative Party of Canada | Defeated (unconfirmed) |
| Quebec | Pontiac | Giroux, Denise | New Democratic Party | Defeated (unconfirmed) |
| Quebec | Pontiac | Gottfred, David Bruce | People's Party of Canada | Defeated (unconfirmed) |
| Quebec | Pontiac | Labonté-Chartrand, Geneviève | Free Party Canada | Defeated (unconfirmed) |
| Quebec | Pontiac | McArthur, Shaughn | Green Party of Canada | Defeated (unconfirmed) |
| Quebec | Pontiac | McNair, James | Canada's Fourth Front | Defeated (unconfirmed) |
| Quebec | Portneuf—Jacques-Cartier | Diallo, Sani | Liberal Party of Canada | Defeated (unconfirmed) |
| Quebec | Portneuf—Jacques-Cartier | Fiset, Charles | Free Party Canada | Defeated (unconfirmed) |
| Quebec | Portneuf—Jacques-Cartier | Gagnon, David | New Democratic Party | Defeated (unconfirmed) |
| Quebec | Portneuf—Jacques-Cartier | Godin, Joël | Conservative Party of Canada | Re-Elected (unconfirmed) |
| Quebec | Portneuf—Jacques-Cartier | Hébert, Christian | Bloc Québécois | Defeated (unconfirmed) |
| Quebec | Portneuf—Jacques-Cartier | Mathieu, Nash | People's Party of Canada | Defeated (unconfirmed) |
| Quebec | Portneuf—Jacques-Cartier | Pelletier, Tommy | Parti Rhinocéros Party | Defeated (unconfirmed) |
| Quebec | Québec | Boulé, Tommy | New Democratic Party | Defeated (unconfirmed) |
| Quebec | Québec | Boutin, Bianca | Conservative Party of Canada | Defeated (unconfirmed) |
| Quebec | Québec | Brisson, Daniel | People's Party of Canada | Defeated (unconfirmed) |
| Quebec | Québec | Duclos, Hon. Jean-Yves | Liberal Party of Canada | Re-Elected (unconfirmed) |
| Quebec | Québec | Kerr, Patrick | Green Party of Canada | Defeated (unconfirmed) |
| Quebec | Québec | Sansfaçon, Louis | Bloc Québécois | Defeated (unconfirmed) |
| Quebec | Québec | Simard, Karine | Free Party Canada | Defeated (unconfirmed) |
| Quebec | Repentigny | Bapfou Vozang Siewe, Pascal | Conservative Party of Canada | Defeated (unconfirmed) |
| Quebec | Repentigny | Boucher Granger, Micheline | Parti pour l'Indépendance du Québec | Defeated (unconfirmed) |
| Quebec | Repentigny | Duval, Pierre | Free Party Canada | Defeated (unconfirmed) |
| Quebec | Repentigny | Kernizan, Yvelie | Liberal Party of Canada | Defeated (unconfirmed) |
| Quebec | Repentigny | Mathieu Chauvette, Naomie | New Democratic Party | Defeated (unconfirmed) |
| Quebec | Repentigny | Pauzé, Monique | Bloc Québécois | Re-Elected (unconfirmed) |
| Quebec | Richmond—Arthabaska | Bureau, Nataël | New Democratic Party | Defeated (unconfirmed) |
| Quebec | Richmond—Arthabaska | Delisle, Marjolaine | Parti Rhinocéros Party | Defeated (unconfirmed) |
| Quebec | Richmond—Arthabaska | Desmarais, Alexandre | Liberal Party of Canada | Defeated (unconfirmed) |
| Quebec | Richmond—Arthabaska | Fougeron, Nadine | People's Party of Canada | Defeated (unconfirmed) |
| Quebec | Richmond—Arthabaska | Rayes, Alain | Conservative Party of Canada | Re-Elected (unconfirmed) |
| Quebec | Richmond—Arthabaska | Richard, Louis | Free Party Canada | Defeated (unconfirmed) |
| Quebec | Richmond—Arthabaska | Scalzo, Diego | Bloc Québécois | Defeated (unconfirmed) |
| Quebec | Rimouski-Neigette—Témiscouata—Les Basques | Blanchette-Joncas, Maxime | Bloc Québécois | Re-Elected (unconfirmed) |
| Quebec | Rimouski-Neigette—Témiscouata—Les Basques | Bureau-Civil, Noémi | Independent | Defeated (unconfirmed) |
| Quebec | Rimouski-Neigette—Témiscouata—Les Basques | Gagnon, France | Conservative Party of Canada | Defeated (unconfirmed) |
| Quebec | Rimouski-Neigette—Témiscouata—Les Basques | Hodges, Megan | Parti Rhinocéros Party | Defeated (unconfirmed) |
| Quebec | Rimouski-Neigette—Témiscouata—Les Basques | Lajoie, Léonie | Liberal Party of Canada | Defeated (unconfirmed) |
| Quebec | Rimouski-Neigette—Témiscouata—Les Basques | Lajoie, Sylvain | New Democratic Party | Defeated (unconfirmed) |
| Quebec | Rimouski-Neigette—Témiscouata—Les Basques | Raymond, Michel | Free Party Canada | Defeated (unconfirmed) |
| Quebec | Rimouski-Neigette—Témiscouata—Les Basques | Tardy, Jean | People's Party of Canada | Defeated (unconfirmed) |
| Quebec | Rivière-des-Mille-Îles | Beauséjour, Valérie | Free Party Canada | Defeated (unconfirmed) |
| Quebec | Rivière-des-Mille-Îles | Buté, Julius | Parti pour l'Indépendance du Québec | Defeated (unconfirmed) |
| Quebec | Rivière-des-Mille-Îles | Desilets, Luc | Bloc Québécois | Re-Elected (unconfirmed) |
| Quebec | Rivière-des-Mille-Îles | Dionne, Michael | Parti Patriote | Defeated (unconfirmed) |
| Quebec | Rivière-des-Mille-Îles | Duffy-Vincelette, Marc | Conservative Party of Canada | Defeated (unconfirmed) |
| Quebec | Rivière-des-Mille-Îles | Hakizimana, Joseph | New Democratic Party | Defeated (unconfirmed) |
| Quebec | Rivière-des-Mille-Îles | Lapointe, Linda | Liberal Party of Canada | Defeated (unconfirmed) |
| Quebec | Rivière-des-Mille-Îles | Roker Jr, Hans | People's Party of Canada | Defeated (unconfirmed) |
| Quebec | Rivière-des-Mille-Îles | Ware, Alec | Green Party of Canada | Defeated (unconfirmed) |
| Quebec | Rivière-du-Nord | Bajkin, Theodora | Liberal Party of Canada | Defeated (unconfirmed) |
| Quebec | Rivière-du-Nord | Damour, Marie-Eve | Free Party Canada | Defeated (unconfirmed) |
| Quebec | Rivière-du-Nord | Fortin, Rhéal Éloi | Bloc Québécois | Re-Elected (unconfirmed) |
| Quebec | Rivière-du-Nord | Morrissette, Patricia | Conservative Party of Canada | Defeated (unconfirmed) |
| Quebec | Rivière-du-Nord | Paspaliaris, Mary-Helen | New Democratic Party | Defeated (unconfirmed) |
| Quebec | Rivière-du-Nord | Ravanshid, Ethan Keeyan | People's Party of Canada | Defeated (unconfirmed) |
| Quebec | Rivière-du-Nord | René, Jean-François | Parti Rhinocéros Party | Defeated (unconfirmed) |
| Quebec | Rivière-du-Nord | Riqueur-Lainé, Nicolas | Parti pour l'Indépendance du Québec | Defeated (unconfirmed) |
| Quebec | Rosemont—La Petite-Patrie | Boulerice, Alexandre | New Democratic Party | Re-Elected (unconfirmed) |
| Quebec | Rosemont—La Petite-Patrie | Desrochers, Gisèle | Marxist-Leninist Party of Canada | Defeated (unconfirmed) |
| Quebec | Rosemont—La Petite-Patrie | Drolet, Nancy | Liberal Party of Canada | Defeated (unconfirmed) |
| Quebec | Rosemont—La Petite-Patrie | Fiori, Franco | Green Party of Canada | Defeated (unconfirmed) |
| Quebec | Rosemont—La Petite-Patrie | Perez Hernandez, Surelys | Conservative Party of Canada | Defeated (unconfirmed) |
| Quebec | Rosemont—La Petite-Patrie | Vaithyanathasarma, Shophika | Bloc Québécois | Defeated (unconfirmed) |
| Quebec | Saint-Hyacinthe—Bagot | Boucher, Caroline-Joan | Liberal Party of Canada | Defeated (unconfirmed) |
| Quebec | Saint-Hyacinthe—Bagot | Desautels, Sébastien | Free Party Canada | Defeated (unconfirmed) |
| Quebec | Saint-Hyacinthe—Bagot | Lepage, André | Conservative Party of Canada | Defeated (unconfirmed) |
| Quebec | Saint-Hyacinthe—Bagot | Pariseau, Sylvain | People's Party of Canada | Defeated (unconfirmed) |
| Quebec | Saint-Hyacinthe—Bagot | Sansoucy, Brigitte | New Democratic Party | Defeated (unconfirmed) |
| Quebec | Saint-Hyacinthe—Bagot | Savard-Tremblay, Simon-Pierre | Bloc Québécois | Re-Elected (unconfirmed) |
| Quebec | Saint-Jean | Benoit, Serge | Conservative Party of Canada | Defeated (unconfirmed) |
| Quebec | Saint-Jean | Cléroux, Jean-Charles | Free Party Canada | Defeated (unconfirmed) |
| Quebec | Saint-Jean | Duteau, Pierre | Parti pour l'Indépendance du Québec | Defeated (unconfirmed) |
| Quebec | Saint-Jean | Fournier, Jeremy | New Democratic Party | Defeated (unconfirmed) |
| Quebec | Saint-Jean | Normandin, Christine | Bloc Québécois | Re-Elected (unconfirmed) |
| Quebec | Saint-Jean | Rioux, Jean R. | Liberal Party of Canada | Defeated (unconfirmed) |
| Quebec | Saint-Jean | Vaillancourt Ryan, Leigh | Green Party of Canada | Defeated (unconfirmed) |
| Quebec | Saint-Laurent | Boutet, Ginette | Marxist-Leninist Party of Canada | Defeated (unconfirmed) |
| Quebec | Saint-Laurent | Devereaux, Nathan | New Democratic Party | Defeated (unconfirmed) |
| Quebec | Saint-Laurent | Lambropoulos, Emmanuella | Liberal Party of Canada | Re-Elected (unconfirmed) |
| Quebec | Saint-Laurent | Racicot, Florence | Bloc Québécois | Defeated (unconfirmed) |
| Quebec | Saint-Laurent | Serour, Richard | Conservative Party of Canada | Defeated (unconfirmed) |
| Quebec | Saint-Laurent | Yablunovsky, Gregory | People's Party of Canada | Defeated (unconfirmed) |
| Quebec | Saint-Léonard—Saint-Michel | Di Tullio, Alicia | New Democratic Party | Defeated (unconfirmed) |
| Quebec | Saint-Léonard—Saint-Michel | Ialenti, Louis | Conservative Party of Canada | Defeated (unconfirmed) |
| Quebec | Saint-Léonard—Saint-Michel | Lattanzio, Patricia | Liberal Party of Canada | Re-Elected (unconfirmed) |
| Quebec | Saint-Léonard—Saint-Michel | Massey, Laurence | Bloc Québécois | Defeated (unconfirmed) |
| Quebec | Saint-Léonard—Saint-Michel | Ritacca, Daniele | People's Party of Canada | Defeated (unconfirmed) |
| Quebec | Saint-Maurice—Champlain | Beaumont Tremblay, Hugo | Marijuana Party | Defeated (unconfirmed) |
| Quebec | Saint-Maurice—Champlain | Bergeron, Valérie | New Democratic Party | Defeated (unconfirmed) |
| Quebec | Saint-Maurice—Champlain | Bouchard, Jacques A. | Conservative Party of Canada | Defeated (unconfirmed) |
| Quebec | Saint-Maurice—Champlain | Bruneau, Jacynthe | Bloc Québécois | Defeated (unconfirmed) |
| Quebec | Saint-Maurice—Champlain | Champagne, Hon. François-Philippe | Liberal Party of Canada | Re-Elected (unconfirmed) |
| Quebec | Saint-Maurice—Champlain | Fraser, Jean-Pierre | Parti Rhinocéros Party | Defeated (unconfirmed) |
| Quebec | Saint-Maurice—Champlain | Gaudet, Marie-Claude | Green Party of Canada | Defeated (unconfirmed) |
| Quebec | Saint-Maurice—Champlain | Magnan, Alain | Independent | Defeated (unconfirmed) |
| Quebec | Saint-Maurice—Champlain | Rouleau, Marie Gabrielle | Free Party Canada | Defeated (unconfirmed) |
| Quebec | Salaberry—Suroît | Bertrand, Luc | Parti pour l'Indépendance du Québec | Defeated (unconfirmed) |
| Quebec | Salaberry—Suroît | Collette, Jean | Conservative Party of Canada | Defeated (unconfirmed) |
| Quebec | Salaberry—Suroît | DeBellefeuille, Claude | Bloc Québécois | Re-Elected (unconfirmed) |
| Quebec | Salaberry—Suroît | Gallant, Linda | Liberal Party of Canada | Defeated (unconfirmed) |
| Quebec | Salaberry—Suroît | Gottman, Joan | New Democratic Party | Defeated (unconfirmed) |
| Quebec | Salaberry—Suroît | Goyette, Marcel | Free Party Canada | Defeated (unconfirmed) |
| Quebec | Salaberry—Suroît | Thivierge, Nicolas | People's Party of Canada | Defeated (unconfirmed) |
| Quebec | Shefford | Beaudry-Graham, Jean-Philippe | Parti pour l'Indépendance du Québec | Defeated (unconfirmed) |
| Quebec | Shefford | Breton, Pierre | Liberal Party of Canada | Defeated (unconfirmed) |
| Quebec | Shefford | Brisebois, Yannick | Marijuana Party | Defeated (unconfirmed) |
| Quebec | Shefford | Jasmin, Patrick | New Democratic Party | Defeated (unconfirmed) |
| Quebec | Shefford | Lacroix, Joël | Free Party Canada | Defeated (unconfirmed) |
| Quebec | Shefford | Lalancette, Céline | Conservative Party of Canada | Defeated (unconfirmed) |
| Quebec | Shefford | Larouche, Andréanne | Bloc Québécois | Re-Elected (unconfirmed) |
| Quebec | Shefford | Morin, Mathieu | Green Party of Canada | Defeated (unconfirmed) |
| Quebec | Shefford | Schieder, Gerda | People's Party of Canada | Defeated (unconfirmed) |
| Quebec | Sherbrooke | Berger, Marie-Clarisse | Green Party of Canada | Defeated (unconfirmed) |
| Quebec | Sherbrooke | Boivin, Maxime | Free Party Canada | Defeated (unconfirmed) |
| Quebec | Sherbrooke | Brière, Élisabeth | Liberal Party of Canada | Re-Elected (unconfirmed) |
| Quebec | Sherbrooke | Haidar, Ensaf | Bloc Québécois | Defeated (unconfirmed) |
| Quebec | Sherbrooke | Lalime, Marika | New Democratic Party | Defeated (unconfirmed) |
| Quebec | Sherbrooke | Niculescu, Marcela | People's Party of Canada | Defeated (unconfirmed) |
| Quebec | Sherbrooke | Winters, Andrea | Conservative Party of Canada | Defeated (unconfirmed) |
| Quebec | Terrebonne | Boudrias, Michel | No Affiliation | Defeated (unconfirmed) |
| Quebec | Terrebonne | Desjardins, Frédérick | Conservative Party of Canada | Defeated (unconfirmed) |
| Quebec | Terrebonne | Forget, Eric | Liberal Party of Canada | Defeated (unconfirmed) |
| Quebec | Terrebonne | Fortin-Dubé, Nathan | Free Party Canada | Defeated (unconfirmed) |
| Quebec | Terrebonne | Hamelin- Schuilenburg, David | Green Party of Canada | Defeated (unconfirmed) |
| Quebec | Terrebonne | Mayba, Luke | New Democratic Party | Defeated (unconfirmed) |
| Quebec | Terrebonne | Sinclair-Desgagné, Nathalie | Bloc Québécois | Elected (unconfirmed) |
| Quebec | Terrebonne | Stinziani, Louis | People's Party of Canada | Defeated (unconfirmed) |
| Quebec | Thérèse-De Blainville | Aubé, Vincent | People's Party of Canada | Defeated (unconfirmed) |
| Quebec | Thérèse-De Blainville | Ayoub, Ramez | Liberal Party of Canada | Defeated (unconfirmed) |
| Quebec | Thérèse-De Blainville | Bissonnette, Marc | Conservative Party of Canada | Defeated (unconfirmed) |
| Quebec | Thérèse-De Blainville | Chabot, Louise | Bloc Québécois | Re-Elected (unconfirmed) |
| Quebec | Thérèse-De Blainville | Paré-Poupart, Simon | Green Party of Canada | Defeated (unconfirmed) |
| Quebec | Thérèse-De Blainville | Soumaoro, Julienne | New Democratic Party | Defeated (unconfirmed) |
| Quebec | Thérèse-De Blainville | Tassignon, Peggy | Free Party Canada | Defeated (unconfirmed) |
| Quebec | Trois-Rivières | Brodeur, Gilles | Free Party Canada | Defeated (unconfirmed) |
| Quebec | Trois-Rivières | Francoeur, Martin | Liberal Party of Canada | Defeated (unconfirmed) |
| Quebec | Trois-Rivières | Holman, Andrew Jeffrey | Green Party of Canada | Defeated (unconfirmed) |
| Quebec | Trois-Rivières | Landry, Jean | People's Party of Canada | Defeated (unconfirmed) |
| Quebec | Trois-Rivières | Lévesque, Yves | Conservative Party of Canada | Defeated (unconfirmed) |
| Quebec | Trois-Rivières | Simidzija, Adis | New Democratic Party | Defeated (unconfirmed) |
| Quebec | Trois-Rivières | Villemure, René | Bloc Québécois | Elected (unconfirmed) |
| Quebec | Vaudreuil—Soulanges | Brake, Niklas | New Democratic Party | Defeated (unconfirmed) |
| Quebec | Vaudreuil—Soulanges | Cox, Karen | Conservative Party of Canada | Defeated (unconfirmed) |
| Quebec | Vaudreuil—Soulanges | Destrempes, Ginette | Free Party Canada | Defeated (unconfirmed) |
| Quebec | Vaudreuil—Soulanges | Schiefke, Peter | Liberal Party of Canada | Re-Elected (unconfirmed) |
| Quebec | Vaudreuil—Soulanges | Stiff, Cameron | Green Party of Canada | Defeated (unconfirmed) |
| Quebec | Vaudreuil—Soulanges | Vadnais-Lapierre, Thierry | Bloc Québécois | Defeated (unconfirmed) |
| Quebec | Ville-Marie—Le Sud-Ouest—Île-des-Soeurs | Charbonneau-Lavictoire, Cynthia | Green Party of Canada | Defeated (unconfirmed) |
| Quebec | Ville-Marie—Le Sud-Ouest—Île-des-Soeurs | Dubé, Denise | People's Party of Canada | Defeated (unconfirmed) |
| Quebec | Ville-Marie—Le Sud-Ouest—Île-des-Soeurs | Miller, Hon. Marc | Liberal Party of Canada | Re-Elected (unconfirmed) |
| Quebec | Ville-Marie—Le Sud-Ouest—Île-des-Soeurs | Orihuela-Bouchard, Soledad | Bloc Québécois | Defeated (unconfirmed) |
| Quebec | Ville-Marie—Le Sud-Ouest—Île-des-Soeurs | Shanahan, Steven | Conservative Party of Canada | Defeated (unconfirmed) |
| Quebec | Ville-Marie—Le Sud-Ouest—Île-des-Soeurs | Sullivan, Linda | Marxist-Leninist Party of Canada | Defeated (unconfirmed) |
| Quebec | Ville-Marie—Le Sud-Ouest—Île-des-Soeurs | Thiébaut, Sophie | New Democratic Party | Defeated (unconfirmed) |
| Quebec | Ville-Marie—Le Sud-Ouest—Île-des-Soeurs | Vargas, Hans Armando | Marijuana Party | Defeated (unconfirmed) |
| Quebec | Vimy | Aliev, Vassif | New Democratic Party | Defeated (unconfirmed) |
| Quebec | Vimy | Bandou, Rachid | Bloc Québécois | Defeated (unconfirmed) |
| Quebec | Vimy | El-Helou, Rima | Conservative Party of Canada | Defeated (unconfirmed) |
| Quebec | Vimy | Koutrakis, Annie | Liberal Party of Canada | Re-Elected (unconfirmed) |
| Quebec | Vimy | Morales-Loaiza, Alejandro | People's Party of Canada | Defeated (unconfirmed) |
| Saskatchewan | Battlefords—Lloydminster | Falk, Rosemarie | Conservative Party of Canada | Re-Elected (unconfirmed) |
| Saskatchewan | Battlefords—Lloydminster | Hansen, Erik | New Democratic Party | Defeated (unconfirmed) |
| Saskatchewan | Battlefords—Lloydminster | Ingram, Larry | Liberal Party of Canada | Defeated (unconfirmed) |
| Saskatchewan | Battlefords—Lloydminster | Rutherford, Kenneth | Maverick Party | Defeated (unconfirmed) |
| Saskatchewan | Battlefords—Lloydminster | Sieben, Terrance | People's Party of Canada | Defeated (unconfirmed) |
| Saskatchewan | Battlefords—Lloydminster | Wall, Kerri | Green Party of Canada | Defeated (unconfirmed) |
| Saskatchewan | Carlton Trail—Eagle Creek | Andruschak, Harrison | Liberal Party of Canada | Defeated (unconfirmed) |
| Saskatchewan | Carlton Trail—Eagle Creek | Block, Kelly | Conservative Party of Canada | Re-Elected (unconfirmed) |
| Saskatchewan | Carlton Trail—Eagle Creek | Bohach, Micheal | People's Party of Canada | Defeated (unconfirmed) |
| Saskatchewan | Carlton Trail—Eagle Creek | O'Toole, Shannon | New Democratic Party | Defeated (unconfirmed) |
| Saskatchewan | Carlton Trail—Eagle Creek | Pastoor, Diane | Maverick Party | Defeated (unconfirmed) |
| Saskatchewan | Carlton Trail—Eagle Creek | Reemaul, Cherese | Green Party of Canada | Defeated (unconfirmed) |
| Saskatchewan | Cypress Hills—Grasslands | Hird, Mackenzie | Liberal Party of Canada | Defeated (unconfirmed) |
| Saskatchewan | Cypress Hills—Grasslands | Hislop, Charles | People's Party of Canada | Defeated (unconfirmed) |
| Saskatchewan | Cypress Hills—Grasslands | Lewans, Maria | Independent | Defeated (unconfirmed) |
| Saskatchewan | Cypress Hills—Grasslands | McPhee, Alexander | New Democratic Party | Defeated (unconfirmed) |
| Saskatchewan | Cypress Hills—Grasslands | Patzer, Jeremy | Conservative Party of Canada | Re-Elected (unconfirmed) |
| Saskatchewan | Cypress Hills—Grasslands | Skagen, Mark | Maverick Party | Defeated (unconfirmed) |
| Saskatchewan | Cypress Hills—Grasslands | Vandale, Carol | Green Party of Canada | Defeated (unconfirmed) |
| Saskatchewan | Desnethé—Missinippi—Churchill River | Belanger, Harold | Liberal Party of Canada | Defeated (unconfirmed) |
| Saskatchewan | Desnethé—Missinippi—Churchill River | Chalifoux, Nasser-Dean | Green Party of Canada | Defeated (unconfirmed) |
| Saskatchewan | Desnethé—Missinippi—Churchill River | King, Harmonie | New Democratic Party | Defeated (unconfirmed) |
| Saskatchewan | Desnethé—Missinippi—Churchill River | King, Stephen | Independent | Defeated (unconfirmed) |
| Saskatchewan | Desnethé—Missinippi—Churchill River | Reddekopp, Dezirae | People's Party of Canada | Defeated (unconfirmed) |
| Saskatchewan | Desnethé—Missinippi—Churchill River | Vidal, Gary | Conservative Party of Canada | Re-Elected (unconfirmed) |
| Saskatchewan | Moose Jaw—Lake Centre—Lanigan | Craik, Chey | People's Party of Canada | Defeated (unconfirmed) |
| Saskatchewan | Moose Jaw—Lake Centre—Lanigan | Hunter, Isaiah | Green Party of Canada | Defeated (unconfirmed) |
| Saskatchewan | Moose Jaw—Lake Centre—Lanigan | Regent, Talon | New Democratic Party | Defeated (unconfirmed) |
| Saskatchewan | Moose Jaw—Lake Centre—Lanigan | Tolmie, Fraser | Conservative Party of Canada | Elected (unconfirmed) |
| Saskatchewan | Moose Jaw—Lake Centre—Lanigan | Townsend, David | Maverick Party | Defeated (unconfirmed) |
| Saskatchewan | Moose Jaw—Lake Centre—Lanigan | Zimmer, Katelyn | Liberal Party of Canada | Defeated (unconfirmed) |
| Saskatchewan | Prince Albert | Graham, Hamish | Green Party of Canada | Defeated (unconfirmed) |
| Saskatchewan | Prince Albert | Hjertaas, Estelle | Liberal Party of Canada | Defeated (unconfirmed) |
| Saskatchewan | Prince Albert | Hoback, Randy | Conservative Party of Canada | Re-Elected (unconfirmed) |
| Saskatchewan | Prince Albert | MacDougall, Ken | New Democratic Party | Defeated (unconfirmed) |
| Saskatchewan | Prince Albert | McCrea, Joseph | People's Party of Canada | Defeated (unconfirmed) |
| Saskatchewan | Prince Albert | Schmitt, Heather | Maverick Party | Defeated (unconfirmed) |
| Saskatchewan | Regina—Lewvan | Cameron, Susan | Liberal Party of Canada | Defeated (unconfirmed) |
| Saskatchewan | Regina—Lewvan | Donaldson, Tria | New Democratic Party | Defeated (unconfirmed) |
| Saskatchewan | Regina—Lewvan | Kletchko, Roderick | People's Party of Canada | Defeated (unconfirmed) |
| Saskatchewan | Regina—Lewvan | Steinley, Warren | Conservative Party of Canada | Re-Elected (unconfirmed) |
| Saskatchewan | Regina—Lewvan | Wright, Michael | Green Party of Canada | Defeated (unconfirmed) |
| Saskatchewan | Regina—Qu'Appelle | Bos, Annaliese | New Democratic Party | Defeated (unconfirmed) |
| Saskatchewan | Regina—Qu'Appelle | Hunter, Naomi | Green Party of Canada | Defeated (unconfirmed) |
| Saskatchewan | Regina—Qu'Appelle | Melanson, Cecilia | Liberal Party of Canada | Defeated (unconfirmed) |
| Saskatchewan | Regina—Qu'Appelle | Scheer, Hon. Andrew | Conservative Party of Canada | Re-Elected (unconfirmed) |
| Saskatchewan | Regina—Qu'Appelle | Yubeta, Andrew | People's Party of Canada | Defeated (unconfirmed) |
| Saskatchewan | Regina—Wascana | Hidlebaugh, Erin | New Democratic Party | Defeated (unconfirmed) |
| Saskatchewan | Regina—Wascana | Kram, Michael | Conservative Party of Canada | Re-Elected (unconfirmed) |
| Saskatchewan | Regina—Wascana | Lau, Victor | Green Party of Canada | Defeated (unconfirmed) |
| Saskatchewan | Regina—Wascana | McEachern, Sean | Liberal Party of Canada | Defeated (unconfirmed) |
| Saskatchewan | Regina—Wascana | Milanovski, Mario | People's Party of Canada | Defeated (unconfirmed) |
| Saskatchewan | Saskatoon—Grasswood | Friesen, Mark | People's Party of Canada | Defeated (unconfirmed) |
| Saskatchewan | Saskatoon—Grasswood | Kitzul, Kyla | New Democratic Party | Defeated (unconfirmed) |
| Saskatchewan | Saskatoon—Grasswood | Sarwar, Rokhan | Liberal Party of Canada | Defeated (unconfirmed) |
| Saskatchewan | Saskatoon—Grasswood | Walker, Gillian | Green Party of Canada | Defeated (unconfirmed) |
| Saskatchewan | Saskatoon—Grasswood | Waugh, Kevin | Conservative Party of Canada | Re-Elected (unconfirmed) |
| Saskatchewan | Saskatoon—University | Card, Claire | New Democratic Party | Defeated (unconfirmed) |
| Saskatchewan | Saskatoon—University | Dumont Walker, Dawn | Liberal Party of Canada | Defeated (unconfirmed) |
| Saskatchewan | Saskatoon—University | Fisher, Jeremy | Communist Party of Canada | Defeated (unconfirmed) |
| Saskatchewan | Saskatoon—University | Hunter, North-Marie | Green Party of Canada | Defeated (unconfirmed) |
| Saskatchewan | Saskatoon—University | Penteado, Luiz | People's Party of Canada | Defeated (unconfirmed) |
| Saskatchewan | Saskatoon—University | Tochor, Corey | Conservative Party of Canada | Re-Elected (unconfirmed) |
| Saskatchewan | Saskatoon—University | Wesolowski, Carl | Christian Heritage Party of Canada | Defeated (unconfirmed) |
| Saskatchewan | Saskatoon West | Boychuk, Kevin | People's Party of Canada | Defeated (unconfirmed) |
| Saskatchewan | Saskatoon West | Doucette, Robert | New Democratic Party | Defeated (unconfirmed) |
| Saskatchewan | Saskatoon West | Greenfield, David | Green Party of Canada | Defeated (unconfirmed) |
| Saskatchewan | Saskatoon West | Rajakumar, Alphonsus | Liberal Party of Canada | Defeated (unconfirmed) |
| Saskatchewan | Saskatoon West | Redekopp, Brad | Conservative Party of Canada | Re-Elected (unconfirmed) |
| Saskatchewan | Souris—Moose Mountain | Ames-Sinclair, Javin | Liberal Party of Canada | Defeated (unconfirmed) |
| Saskatchewan | Souris—Moose Mountain | Douglas, Greg | Maverick Party | Defeated (unconfirmed) |
| Saskatchewan | Souris—Moose Mountain | Duerr, Hannah | New Democratic Party | Defeated (unconfirmed) |
| Saskatchewan | Souris—Moose Mountain | Kitchen, Robert | Conservative Party of Canada | Re-Elected (unconfirmed) |
| Saskatchewan | Souris—Moose Mountain | Neufeld, Diane | People's Party of Canada | Defeated (unconfirmed) |
| Saskatchewan | Yorkton—Melville | Ames-Sinclair, Jordan | Liberal Party of Canada | Defeated (unconfirmed) |
| Saskatchewan | Yorkton—Melville | Brooks, Valerie | Green Party of Canada | Defeated (unconfirmed) |
| Saskatchewan | Yorkton—Melville | Loucks, Denise | Maverick Party | Defeated (unconfirmed) |
| Saskatchewan | Yorkton—Melville | Robertson, Braden | People's Party of Canada | Defeated (unconfirmed) |
| Saskatchewan | Yorkton—Melville | Rust, Halsten | New Democratic Party | Defeated (unconfirmed) |
| Saskatchewan | Yorkton—Melville | Wagantall, Cathay | Conservative Party of Canada | Re-Elected (unconfirmed) |
| Yukon | Yukon | Dunlop, Barbara | Conservative Party of Canada | Defeated (unconfirmed) |
| Yukon | Yukon | Hanley, Brendan | Liberal Party of Canada | Elected (unconfirmed) |
| Yukon | Yukon | Morris, Lenore | Green Party of Canada | Defeated (unconfirmed) |
| Yukon | Yukon | Smith, Jonas | Independent | Defeated (unconfirmed) |
| Yukon | Yukon | Vollans-Leduc, Lisa | New Democratic Party | Defeated (unconfirmed) |
No comments:
Post a Comment